
Lotto Tickets Simulation
Loading the math board and drawing, please wait…
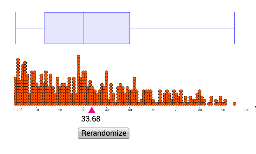
This example demonstrates the statistical process of generating random lotto numbers and displaying their distribution characteristics. It involves core math concepts like arithmetic mean, boxplot, distributions, means, random experiments, statistics, square, integral, median value, stochastic process, and linear equations. Constructed using GeoGebra commands/objects such as Sequence, DotPlot, and BoxPlot, it is suitable for high school and above learners to understand the application of random variable distributions and statistical graphs.
GeoGebra Commands & Parameters
Sequence(Min[Random[1, 100], Random[1, 100]], n, 1, 500) → lottoDotPlot(lotto, false, 0.2) → list1BoxPlot(5, 1, lotto) → a