
Long Term Behaviour 2: Visualizing Differential Equation Solutions
Loading the math board and drawing, please wait…
In collections
MATH1052-edX
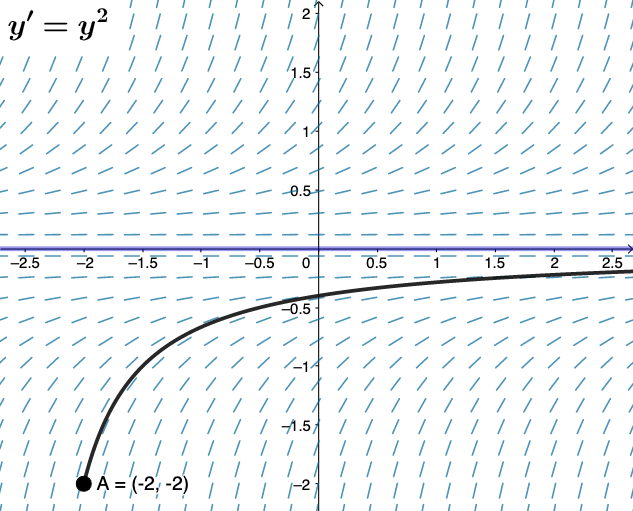
This GeoGebra example demonstrates the long-term behavior of solutions to a first-order differential equation using a slope field and numerical solving. It visualizes how solution curves evolve over time, highlighting concepts such as direction fields, initial value problems, and asymptotic stability. The construction employs the SlopeField command to draw the direction field, SolveODE to compute numerical solutions, and a slider (h) to adjust step size, with a button (button1) to animate. Objects like A, F, Sol1, and text1 support dynamic exploration of different initial conditions. Suitable for high school or college calculus and differential equations courses, it helps students understand solution trends, equilibrium points, and the impact of numerical accuracy on long-term predictions.
GeoGebra Commands & Parameters
SlopeField(f, 25, 0.7) → FSolveODE(f, x(A), y(A), 10, 0.01) → Sol1
AI Drawing Prompt Reference
Create a graph showing the long-term behavior of a first-order differential equation, including a slope field and solution curves. First, draw the slope field, then compute numerical solution curves based on initial conditions, and observe how the solution curves change with different step sizes.
The prompt above was compiled from the original drawing commands and is for reference only.