
Logistic vs. Exponential Growth Models
Loading the math board and drawing, please wait…
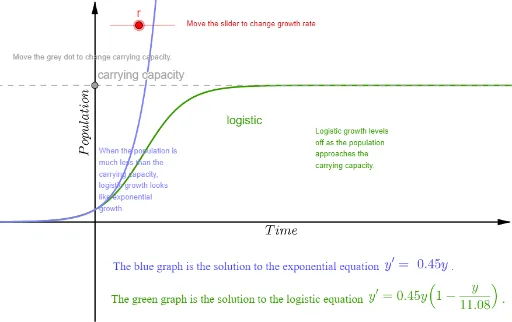
This GeoGebra example dynamically compares exponential growth and logistic growth models. It demonstrates how an exponential curve rises indefinitely, while a logistic curve approaches a carrying capacity, forming an S-shaped (sigmoid) trajectory. The core mathematical concepts include differential equations, exponential functions, the logistic equation, limits, asymptotes, and the effect of parameters on curve shape. Construction details: The example uses the Point command to create key points (r, r_1, A, B, C, etc.), sliders or parameters to control growth rate r and carrying capacity y(A), and the FormulaText command to dynamically display the logistic equation y' = r*y*(1 - y/K) as text. It also includes scatter plots and multiple curves (green for the logistic solution, others for exponential or comparison). This resource is suitable for high school to university-level teaching, especially in calculus, differential equations, or mathematical biology courses to explore population growth models and resource limitations.
GeoGebra Commands & Parameters
Point(yAxis) → APoint(p) → BPoint(g) → C