
Logistic Growth with Extinction Threshold
Loading the math board and drawing, please wait…
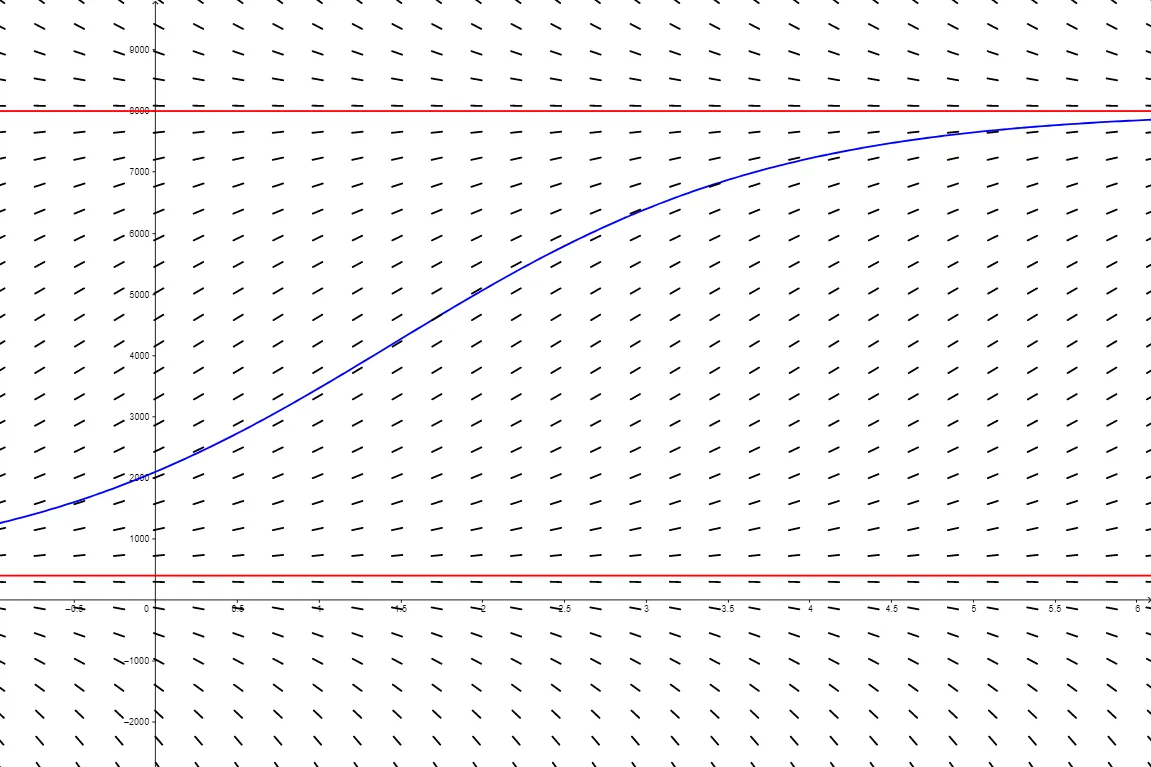
This GeoGebra example demonstrates the solution curves and slope field of a logistic growth model that includes an extinction threshold. The core mathematical concepts involve first-order ordinary differential equations, logistic growth dynamics, equilibrium points and stability, slope fields (direction fields), and initial value problems. The construction uses the SlopeField command to generate the direction field and SolveODE to numerically solve the differential equation. Sliders m, M, and k control the growth rate, carrying capacity, and extinction threshold, while P0 sets the initial population. The objects A and oplossing2 display particular solution curves for chosen initial conditions, with g and h as auxiliary functions and tekst1/tekst2 providing dynamic labels. This resource is suitable for high school to university-level mathematics instruction, helping students visualize population dynamics, interpret differential equations graphically, and explore ecological modeling concepts.
GeoGebra Commands & Parameters
SlopeField(f(x, y), aantal, lengte) → slopefield2SolveODE(f(x, y), A) → oplossing2
AI Drawing Prompt Reference
Draw a logistic growth model with an extinction threshold, showing solution curves for different initial conditions and a direction field. Use sliders to adjust the growth rate, carrying capacity, and extinction threshold, and set the initial population. Display population dynamics through the direction field and solution curves, exploring equilibrium points and stability in ecological modeling.
The prompt above was compiled from the original drawing commands and is for reference only.