
Logistic Growth Exploration
Loading the math board and drawing, please wait…
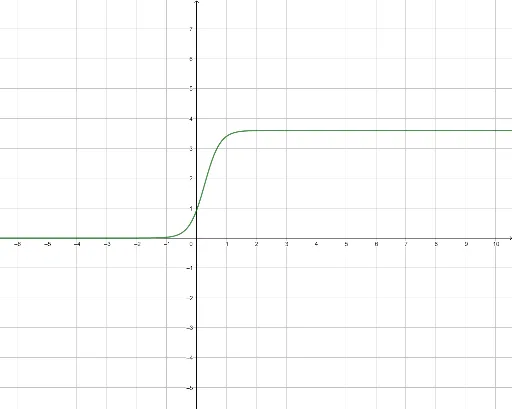
This example uses sliders to explore the logistic curve. The logistic curve is an S-shaped curve often used to model population growth. By adjusting parameters, you can observe changes in the curve's shape. This example involves key mathematical concepts such as functions and parametric equations. It uses GeoGebra sliders and function objects for construction. Suitable for high school mathematics education and learning about logistic growth models.
GeoGebra Commands & Parameters
Numeric a(3.6)Numeric b(2.9)Numeric c(3.9)f(x) = a / (1 + (b * ℯ^((-((c * x))))))