
Explore the Exponential Function a^(x-c)+b
Loading the math board and drawing, please wait…
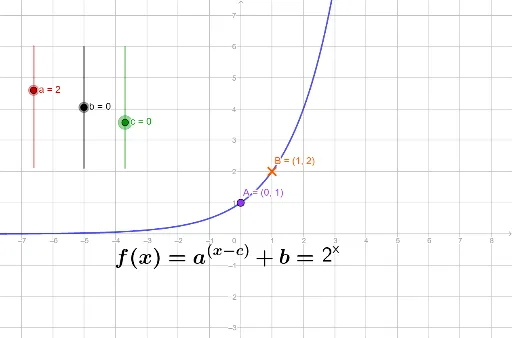
This GeoGebra example dynamically demonstrates how the graph of the exponential function y = a^(x-c)+b changes as parameters a, b, and c are varied using sliders. The core mathematical concepts include exponential functions, parameter effects on graph shape, and horizontal/vertical translations. The construction uses the Intersect command to find intersection points with axes, LaTeX to display the function formula, and slider objects for a, b, c along with function objects f, g and text objects text1, text2. It is suitable for high school students learning exponential functions and their transformations, as well as for teachers to use in classroom demonstrations to visualize how changing parameters affects the graph's position and steepness.
GeoGebra Commands & Parameters
Intersect(f, yAxis, (0, 1)) → ALaTeX(f, true, true) → text1