
Logistic Curve Fitting for Moldova
Loading the math board and drawing, please wait…
In collections
Confirmed Coronavirus Cases in Countries
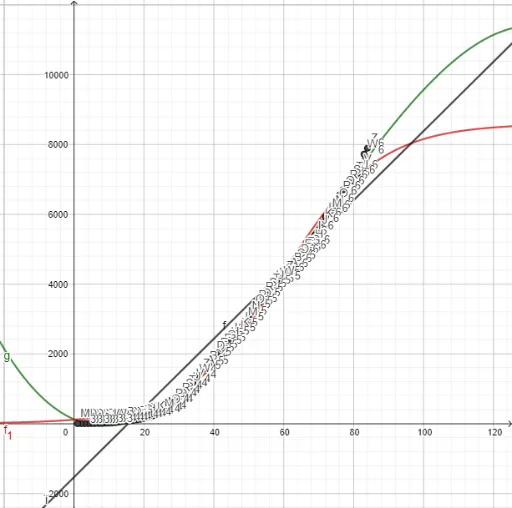
This example demonstrates the logistic curve fitting for population growth in Moldova. Key mathematical concepts include the logistic function and its fitting methods. Using GeoGebra's FitLogistic command, the S-shaped growth curve can be visually observed. Suitable for high school mathematics education, particularly in calculus and function graphing.
GeoGebra Commands & Parameters
FitLogistic(l2) → f_1