
Logarithmic Functions and Inverse Study
Loading the math board and drawing, please wait…
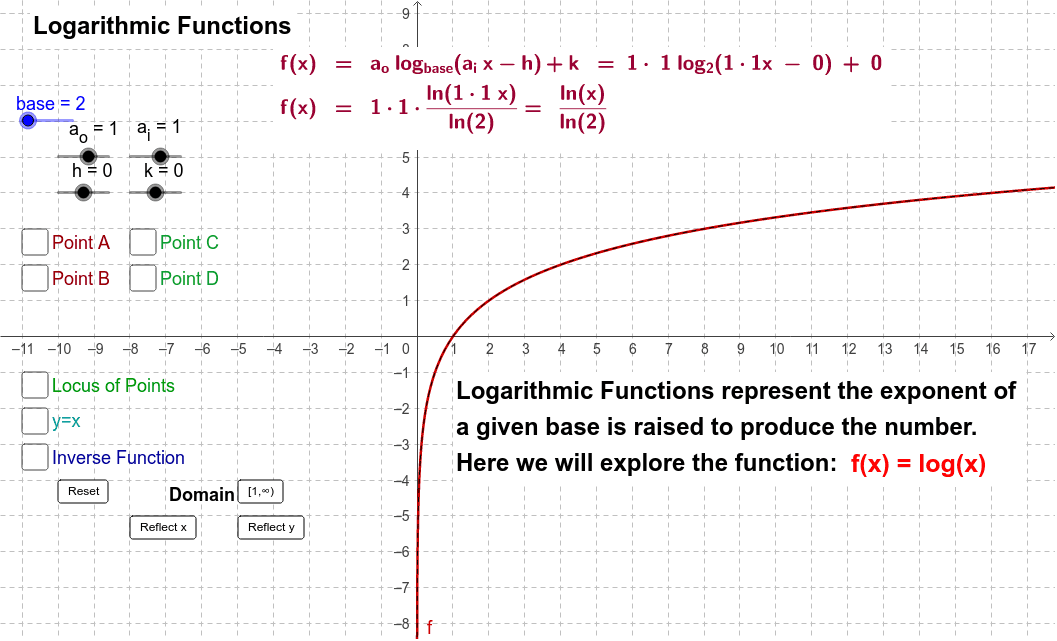
This example demonstrates the relationship and properties of logarithmic functions and their inverses, focusing on graph symmetry and definitions. Core math concepts include logarithmic function definitions, inverse function properties, and graphical transformations. GeoGebra commands and objects used in construction are Point, Locus, r_i, r_o, recip, k, a_o, base, base_r, h, a_i, f, A, C, e, T2, B, D, loc1, g, T1, c, d, j, l, m, n, i, button1, InvFunc, SimpleText, button2, button3, button4, ID, domain, T3, T4. Suitable for high school mathematics education to understand the geometric meaning and transformations of logarithms and inverse functions.
GeoGebra Commands & Parameters
Point(f) → APoint(f) → BLocus(C, A) → loc1
AI Drawing Prompt Reference
Draw the graph of a logarithmic function and its inverse, highlighting their symmetry and relationship, including the logarithmic function curve, the inverse function curve, the axis of symmetry, and the locus of key points, start by plotting two points on the logarithmic function, then plot the locus of one point moving along the axis of symmetry, and finally display the overall symmetry of the function curves.
The prompt above was compiled from the original drawing commands and is for reference only.