
Logarithmic Function Demo by mcdull
Loading the math board and drawing, please wait…
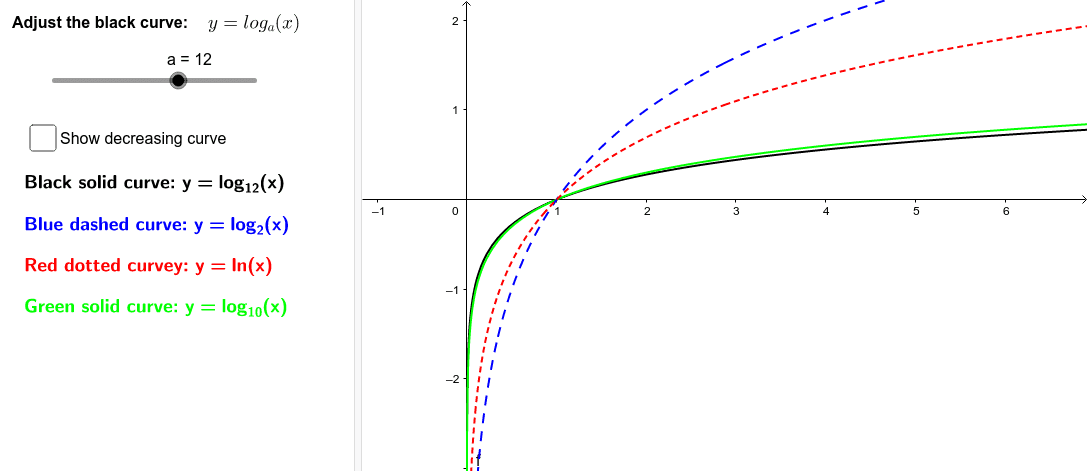
This example demonstrates the graph of logarithmic functions and their transformation rules. Key math concepts include properties of logarithmic functions, function graph transformations, linear equations, and inequalities. Construction highlights involve using GeoGebra's If command to control object visibility, sliders a, b, k to dynamically adjust function f, g, h shapes and positions, and text objects to display mathematical relationships. Suitable for high school mathematics teaching to help students visually understand logarithmic functions and their transformation characteristics.
GeoGebra Commands & Parameters
If(b, -1, 1) → kIf(b, log(0.1, x), lg(x)) → pIf(b, log(0.5, x), log(2, x)) → gIf(b, log(1 / ℯ, x), log(x)) → h
AI Drawing Prompt Reference
Graph logarithmic functions to demonstrate transformation rules, including three function graphs and an inequality region. Use sliders to dynamically adjust the shapes and positions of the functions, display different logarithmic function images through conditional control, and use text annotations to label mathematical relationships, suitable for teaching the characteristics of logarithmic functions.
The prompt above was compiled from the original drawing commands and is for reference only.