
Comparing Logarithmic Function log(x) and Exponential Function 10^x
Loading the math board and drawing, please wait…
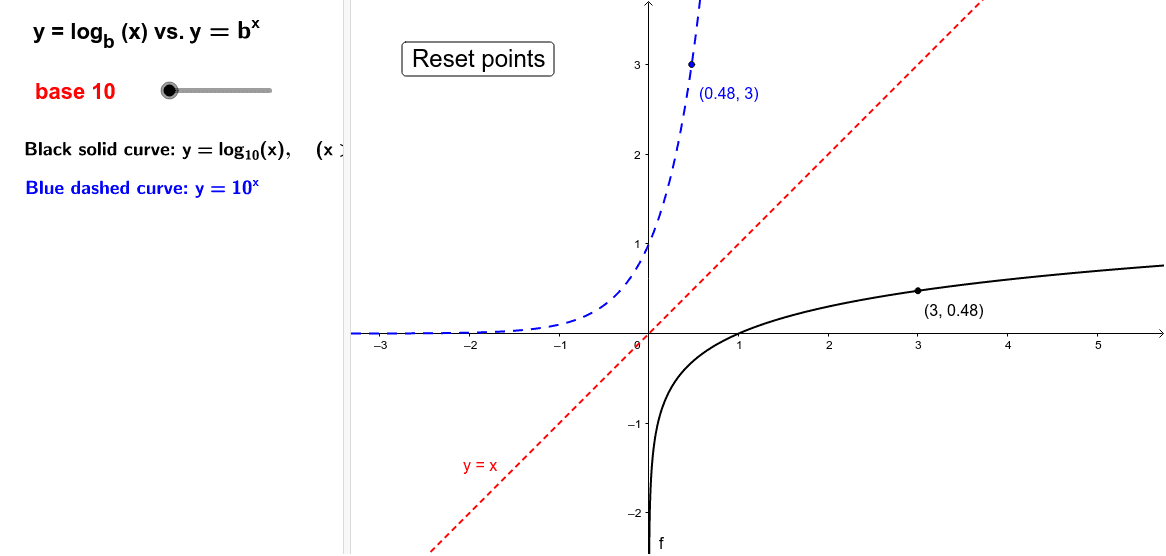
① This GeoGebra example simultaneously displays the graphs of the logarithmic function y = log(x) (base 10) and the exponential function y = 10^x, clearly showing their symmetry about the line y = x. ② Core mathematical concepts include inverse functions, symmetry of function graphs, special points such as (1,0) and (0,1), and the effects of parameter transformations (translation and scaling) on the graphs. ③ Construction details: the commands If and Point are used to create key points and piecewise objects; sliders a, b, k control parameters; list1 stores data; dynamic text objects (logText, lnText) display function expressions; a button (button1) toggles display or resets the view; and objects bb, cc relate to upper/lower sums or Riemann sums for integral approximation. ④ This resource is suitable for high school and college students learning function properties, inverse functions, or introductory calculus, and serves as an interactive demonstration for teachers explaining the symmetry of inverse functions.
GeoGebra Commands & Parameters
If(bb, -1, 1) → k_1If(a ≟ 1, 10^(x), If[a ≟ 2, ℯ^(x), b^(x)]) → gIf(bb, log(0.1, x), lg(x)) → pIf(bb, log(1 / ℯ, x), log(x)) → hIf(bb, logText, lnText) → text8If(a ≠ 2, b, 2.71828) → base01Point(f) → C
AI Drawing Prompt Reference
Draw a coordinate plane showing the graph of a base-10 logarithmic function and its inverse, the base-10 exponential function, symmetric about the line y=x. The log curve passes through (1,0), and the exponential curve through (0,1). Include sliders to adjust the base (including e) and to apply translations and scalings. Mark key points and display dynamic function expressions as text. Add a button to toggle display or reset the view. Also include upper and lower sum objects for integral approximation, showing areas under the curves.
The prompt above was compiled from the original drawing commands and is for reference only.