
Comparing Graphs of log(x) and log(1/x)
Loading the math board and drawing, please wait…
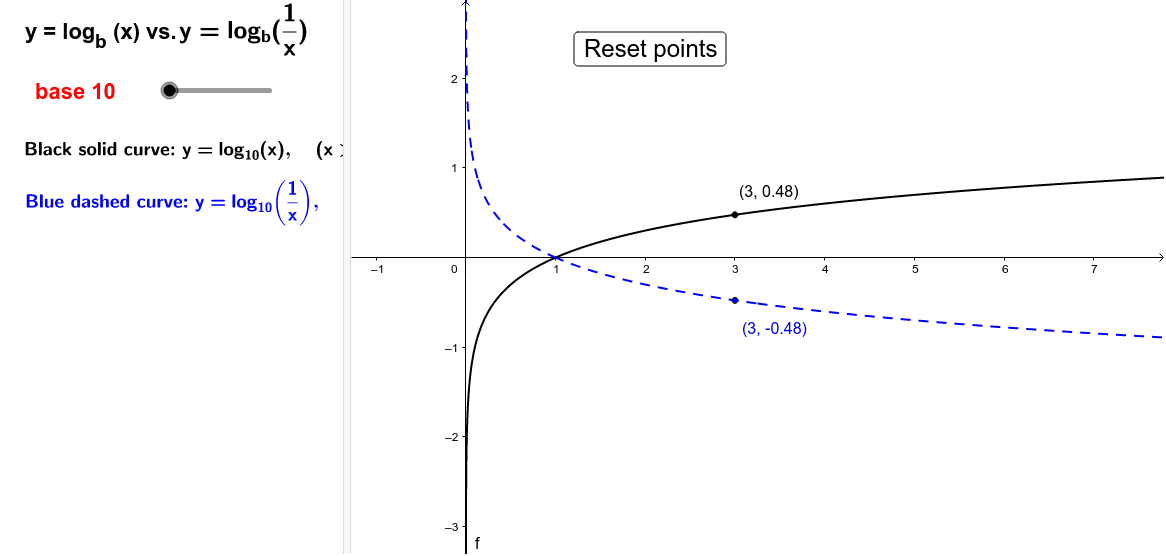
① This GeoGebra example dynamically illustrates the graphs of the logarithmic functions log(x) and log(1/x), highlighting their symmetry about the x-axis and the effect of changing the base. ② Core mathematical concepts include logarithmic properties (especially log(1/x) = -log(x)), graph transformations, base variation (common vs natural log), and piecewise function construction. ③ Construction details: The example uses the If command to build piecewise functions, Point objects for draggable points, a button (button1) and sliders to adjust parameters dynamically. Objects include functions f, g, h, multiple text objects (text1–text11) for displaying expressions and values, a list (list1) for key points, and variables base01 and ba to control the base, allowing flexible exploration of logarithmic graphs under different bases. ④ Suitable for high school and above students learning logarithmic properties, and for teachers demonstrating function transformations and symmetry in class, reinforcing understanding of logarithmic rules and graphical behavior.
GeoGebra Commands & Parameters
If(bb, -1, 1) → k_1If(bb, log(0.1, x), lg(x)) → pIf(bb, log(1 / ℯ, x), log(x)) → hIf(bb, logText, lnText) → text8If(a ≠ 2, b, 2.71828) → base01Point(f) → C
AI Drawing Prompt Reference
Draw the graphs of the logarithmic functions log(x) and log(1/x), showing their symmetry about the x-axis. Use a slider to adjust the base of the logarithm and observe how the functions change. Create functions f and g to represent log(x) and log(1/x), and use if statements to select the logarithm base based on the slider value, dynamically displaying the properties and behavior of the logarithmic functions.
The prompt above was compiled from the original drawing commands and is for reference only.