
Logarithm and Dilation
Loading the math board and drawing, please wait…
This example demonstrates the graph of a logarithmic function and its dilation. Key mathematical concepts include logarithmic functions, dilation, and locus. Using GeoGebra commands such as Polygon, Midpoint, and Segment, the example dynamically shows the changes in the graph of a logarithmic function. Suitable for high school mathematics education and learning.
GeoGebra Commands & Parameters
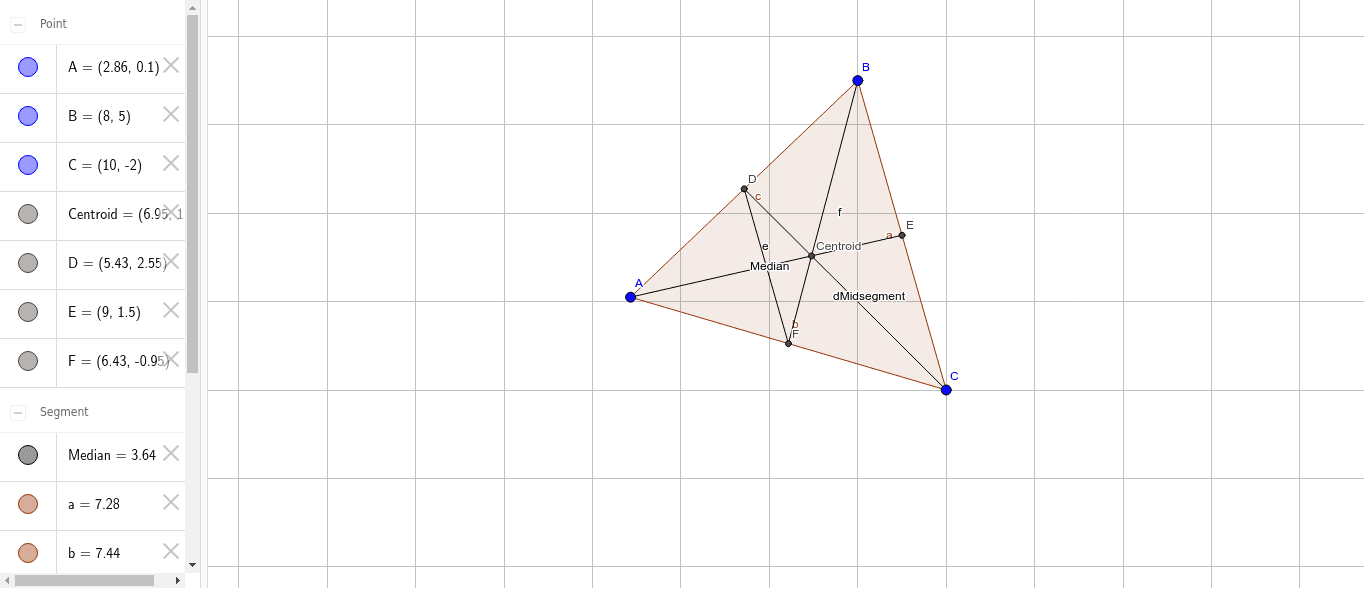
Polygon(A, B, C) → poly1, c, a, bMidpoint(c) → DMidpoint(a) → EMidpoint(b) → FSegment(D, C) → dMidsegmentSegment(E, A) → eSegment(F, B) → fIntersect(dMidsegment, e) → CentroidSegment(D, F) → Median
AI Drawing Prompt Reference
Draw a triangle and label its three sides. Find the midpoint of each side, then connect each midpoint to the opposite vertex to form three medians, which intersect at the centroid. Additionally, take the midpoint of one side and connect it to the opposite vertex to form a midsegment, and connect the midpoint of another side to an adjacent vertex to form another segment. The figure should clearly show the triangle, all midpoints, medians, midsegment, and centroid, illustrating the concept of dilation in logarithmic functions.
The prompt above was compiled from the original drawing commands and is for reference only.