
Live Dotplot
Loading the math board and drawing, please wait…
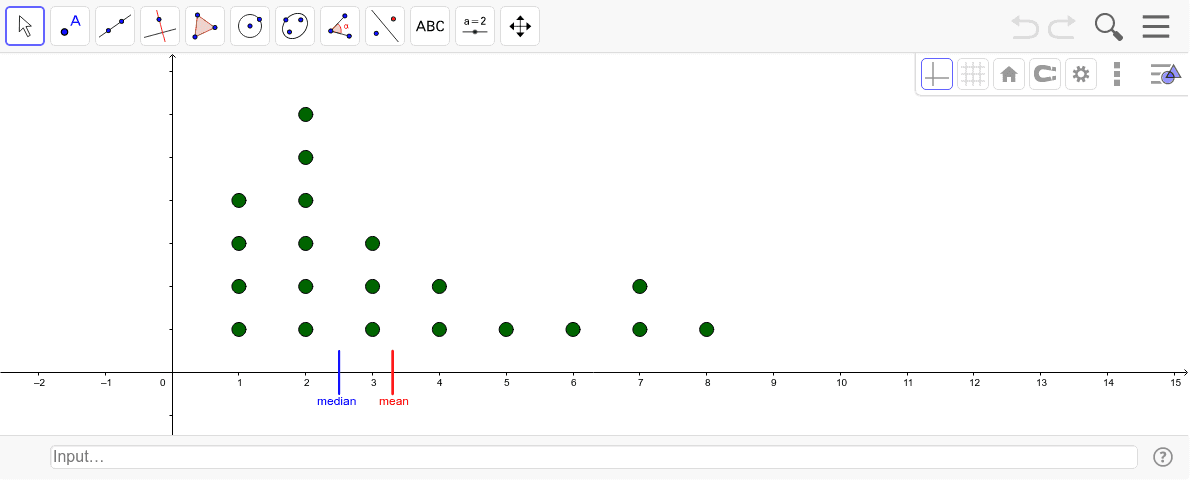
Move points to change the dataset. This example only represents the x-coordinates of each point. It demonstrates dynamic changes in a dot plot, involving statistical concepts of datasets. Commands used include Sequence, BoxPlot, Percentile, Segment, etc. Suitable for middle school and above students learning statistics.
GeoGebra Commands & Parameters
Sequence(x(Element[list1, k]), k, 1, Length[list1]) → list2BoxPlot(-2, 0.5, list2, true) → cPercentile(list2, 0.5) → dPercentile(list2, 0.75) → ePercentile(list2, 0.25) → fSegment((Mean[list2], (-0.5)), (Mean[list2], 0.5)) → gSegment((Median[list2], (-0.5)), (Median[list2], 0.5)) → h
AI Drawing Prompt Reference
Create a dynamic dot plot by moving points to change the dataset. First, generate a list based on the x-coordinates of the points. Then, draw a box plot and show the median, quartiles, and mean. Finally, use segments to mark the positions of the median and mean.
The prompt above was compiled from the original drawing commands and is for reference only.