
Dot Plot Tool by MizJennie
Loading the math board and drawing, please wait…
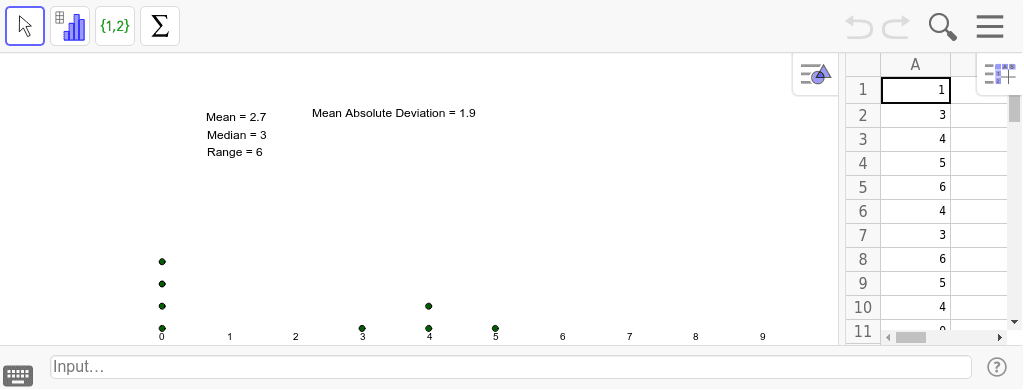
This tool allows up to 30 values to be plotted as a dot plot, demonstrating how data distribution can be visually represented. Key mathematical concepts include statistical data representation. Using GeoGebra commands like DotPlot, Mean, and Median, users can easily create dot plots and calculate the mean and median. Suitable for middle school and above students to learn data statistics and analysis.
GeoGebra Commands & Parameters
DotPlot(A1:A20) → list1Mean(A1:A20) → B1Median(A1:A20) → aMedian(A1:A20) → bMedian(A1:A20) → cMedian(A1:A20) → C1Mean(F1:F20) → G1