
Linking Quadratic Factorising to Graphical Roots
Loading the math board and drawing, please wait…
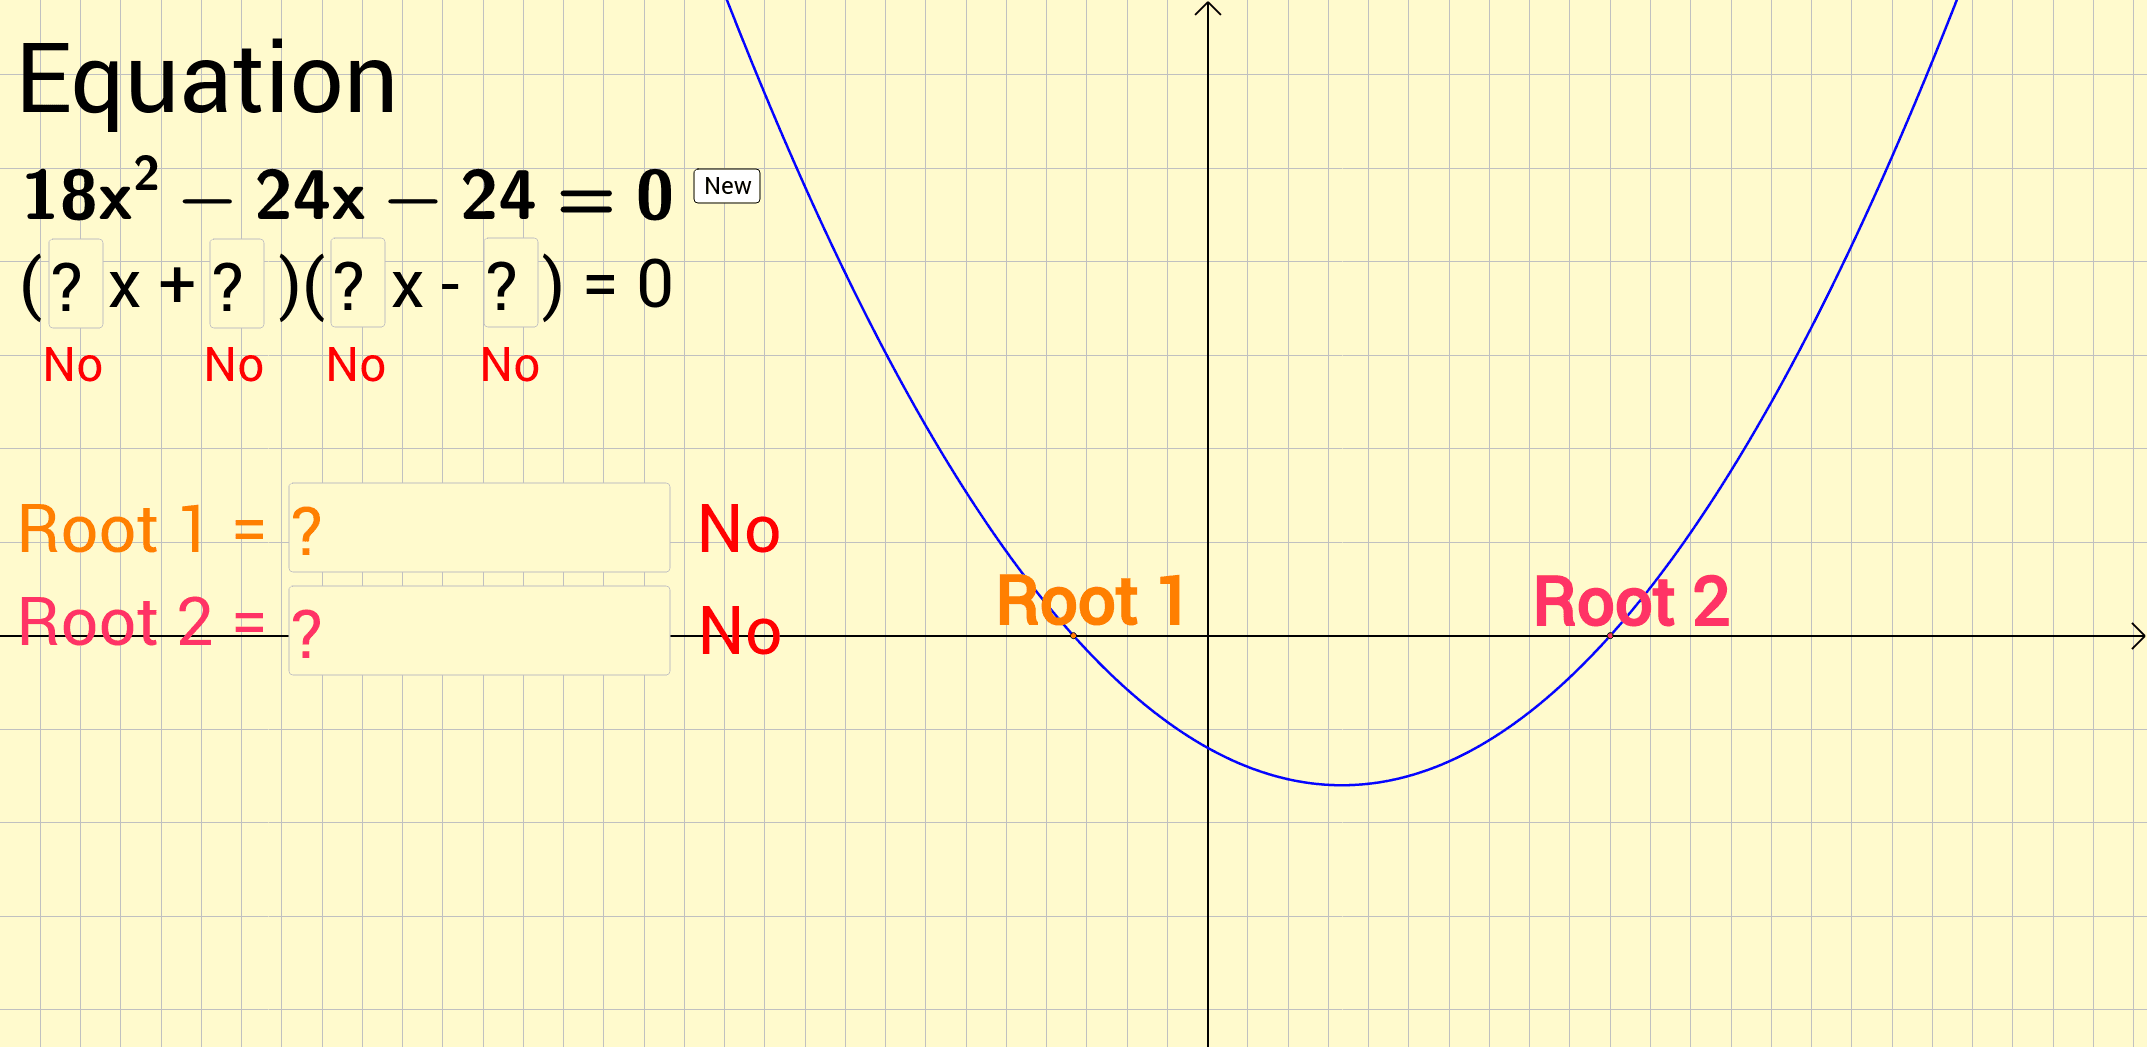
This example visually demonstrates the relationship between quadratic factorization and roots. Key mathematical concepts include quadratic equations, factorization, and roots. It utilizes commands like Random, If, Textfield, Root, and Extremum in GeoGebra. Suitable for middle school and above students to learn about quadratic equations.
GeoGebra Commands & Parameters
Random(-10, 10) → bRandom(1, 9) → aRandom(1, 9) → cRandom(-10, 10) → dIf((a * d) + (b * c) < 0, (-((a * d) + (b * c))), (a * d) + (b * c)) → BIf((b * d) < 0, ((b * d) * (-1)), (b * d)) → CIf((a * d) + (b * c) < 0, "-", "+") → sign1If((b * d) < 0, "-", "+") → sign2If(b < 0, "- ", "+") → sign3If(d < 0, "- ", "+") → sign4Textfield(ansA) → InputBox1Textfield(ansB) → InputBox2Textfield(ansC) → InputBox3Textfield(ansD) → InputBox4Root(f) → L, MTextfield(root1) → InputBox5Textfield(root2) → InputBox6Extremum(f) → N
AI Drawing Prompt Reference
Draw a quadratic function graph with coefficients a, b, c, and d generated by random numbers. Calculate the roots and vertex of the function based on these coefficients. Display the roots and vertex using input boxes. Note that the sign of the roots depends on the signs of b and d, and the sign of the vertex depends on the signs of a and d.
The prompt above was compiled from the original drawing commands and is for reference only.