
Linked Position, Velocity, and Acceleration Graphs via a Velocity-Time Editor
Loading the math board and drawing, please wait…
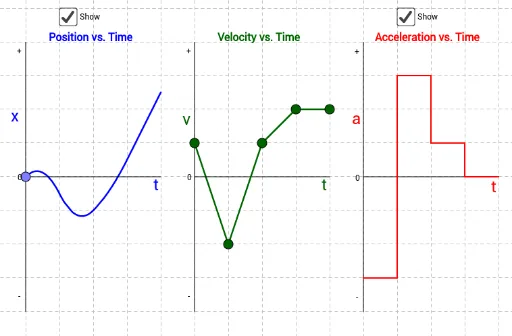
This example lets you reshape a Velocity vs. Time graph by sliding its control points up or down, while simultaneously visualizing the corresponding Position vs. Time and Acceleration vs. Time graphs. It highlights how the “shape” of one kinematics graph determines the other two, offering an intuitive bridge between graph transformations and calculus-style rates of change. Key concepts include function graphs, the slope interpretation (velocity as the time-rate of change of position) and acceleration as the time-rate of change of velocity. Construction-wise, the GeoGebra setup relies on geometric primitives from the provided summary: Segment to build the required line/graph pieces, Point to define control and sampling points, and Midpoint to compute reference midpoints that support consistent segment relationships and correspondences across time intervals. Objects such as A, B, C, D and their indexed counterparts (e.g., A_1, B_1, C_1…; A_2, B_2, C_2…) represent different time nodes or piecewise components used to assemble the linked graphs. Suitable for late secondary school through early university, especially for motion-graph interpretation and teaching intuition for derivatives/rates.
GeoGebra Commands & Parameters
Segment(A, B) → a_3Point(a_3) → RSegment((5, -4), (5, 4)) → m1Point(m1) → ESegment((6, -4), (6, 4)) → m2Point(m2) → FSegment(E, F) → aSegment((9, -4), (9, 4)) → m5Segment((8, -4), (8, 4)) → m4Segment((7, -4), (7, 4)) → m3Midpoint(a_3) → DSegment(D, C) → bSegment(A_1, B_1) → a_1Midpoint(a_1) → D_1Segment(D_1, C_1) → b_1Segment(A_2, B_2) → a_2Midpoint(a_2) → D_2Segment(D_2, C_2) → b_2Point(m3) → GSegment(F, G) → cPoint(m4) → HSegment(G, H) → dPoint(m5) → ISegment(H, I) → eSegment(J, K) → fSegment(K, L) → gSegment(L, M) → hSegment(M, N) → iSegment(N, O) → jSegment(O, P) → kSegment(P, Q) → l
AI Drawing Prompt Reference
Create a linked motion-graph editor showing a Velocity–Time curve reshaped by sliding control points. Build several fixed vertical reference lines at different x-positions, then connect points on these lines to form the piecewise velocity segments. Define endpoints and use midpoints of key segment pieces as consistent reference points so adjacent time intervals stay geometrically aligned. Place additional control/sample points along the same time nodes to let the user move the velocity shape up or down. Display three graphs together: Position–Time corresponding to the velocity shape, and Acceleration–Time corresponding to the time-rate of change of the velocity, so that moving the control points reshapes all linked graphs simultaneously.
The prompt above was compiled from the original drawing commands and is for reference only.