
Linear Transformations of Function Graphs
Loading the math board and drawing, please wait…
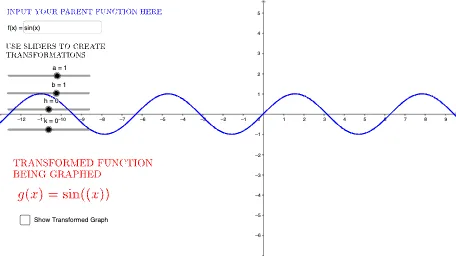
This example demonstrates how linear (affine) transformations modify a function’s graph, letting learners visually compare the original curve with the transformed one under different parameter choices. It focuses on key ideas such as function graphing, geometric interpretation of linear transformations, and how shifts and scalings of inputs/outputs affect the resulting curve. Construction-wise, the setup uses GeoGebra input and labeling tools: a Textfield-based interface to display parameters and equations; the original function object f; and multiple parameter inputs (a, h, k, b, c, d) to define the transformed function. The referenced InputBox1 and additional text objects (text1, text2, text3, text5) support interactive parameter entry and clear on-graph annotation. Suitable for secondary school through early college use, especially for instruction on transformation of graphs, function relationships, and interactive visualization in mathematics lessons.
GeoGebra Commands & Parameters
Textfield(f) → InputBox1
AI Drawing Prompt Reference
Create an interactive display to illustrate linear (affine) transformations of function graphs. Include a text-based input area with fields so parameters can be entered and shown, and use it to define the transformed equation. In the same coordinate plane, plot the original function f, then plot the transformed function graph based on adjustable parameters. Add clear on-graph text annotations to label the key parameters and the corresponding transformation expressions. Provide multiple parameter controls (a, h, k, b, c, d) so learners can visually compare the original curve with the transformed curve as shifts and scalings of inputs and outputs change. Arrange the construction in the order: set up inputs and expressions, draw the original graph and the transformed graph, then add the annotations.
The prompt above was compiled from the original drawing commands and is for reference only.