
Linear Regression
Loading the math board and drawing, please wait…
In collections
Algebra 1
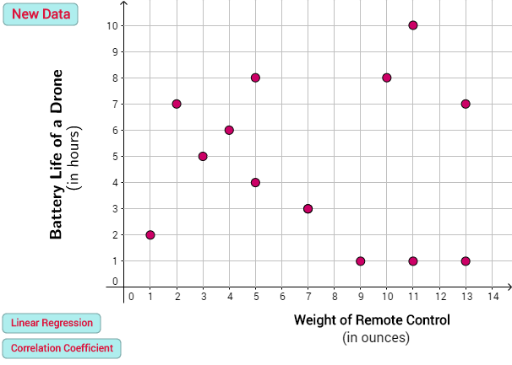
This example demonstrates the concept of linear regression by fitting a line to data points to analyze their correlation. Key mathematical concepts include linear regression, correlation coefficient, and fitting data points. GeoGebra commands such as FitLineY and PMCC are used for data point fitting and correlation analysis. Suitable for high school mathematics education and learning.
GeoGebra Commands & Parameters
FitLineY(list_{data}) → fPMCC(list_{data}) → rRotateText(text3, 7.85) → text4RotateText(text5, 7.85) → text6RotateText(text9, 7.85) → text10RotateText(text11, 7.85) → text12RotateText(text15, 7.85) → text16RotateText(text17, 7.85) → text18RotateText(text21, 7.85) → text22RotateText(text23, 7.85) → text24RotateText(text27, 7.85) → text28RotateText(text30, 7.85) → text31RotateText(text32, 7.85) → text33
AI Drawing Prompt Reference
Draw a set of data points and fit a line to show the linear regression relationship, label the correlation coefficient, rotate some text at a specific angle for clear reading, overall presenting the correlation analysis of data points and the regression line.
The prompt above was compiled from the original drawing commands and is for reference only.