
Linear Regression Game: Fitting a Line to Data
Loading the math board and drawing, please wait…
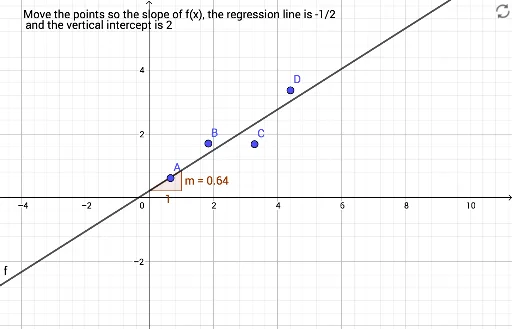
① This interactive example demonstrates how to fit a straight line to a set of scattered data points, visualizing the geometric meaning of linear regression. ② Core mathematical concepts include the method of least squares, linear regression equations, slope and intercept, residuals (distances from points to the fitted line), and the role of similar triangles in understanding slope. ③ Construction highlights: The GeoGebra command FitLineY automatically generates the best-fit line, while Slope computes its slope; objects include data points A, B, C, D, the fitted line f, slope value m, and text objects text1 and text2 displaying the regression equation and statistical information. ④ Suitable for high school or early college students learning statistics and data analysis, and useful for teachers as a classroom demonstration tool to help students grasp the calculation principles of regression lines and intuitively judge the quality of fit.
GeoGebra Commands & Parameters
FitLineY({A, B, C, D}) → fSlope(f) → m
AI Drawing Prompt Reference
Create a scatter plot with four randomly scattered data points. Add a best-fit straight line that minimizes the total vertical distance to the points, representing linear regression. Label the line with its slope value, and include text annotations showing the regression equation and fit statistics. Visually emphasize the vertical gaps between each point and the line to illustrate residuals. Keep the layout clean for classroom demonstration.
The prompt above was compiled from the original drawing commands and is for reference only.