
Linear Regression Example 2
Loading the math board and drawing, please wait…
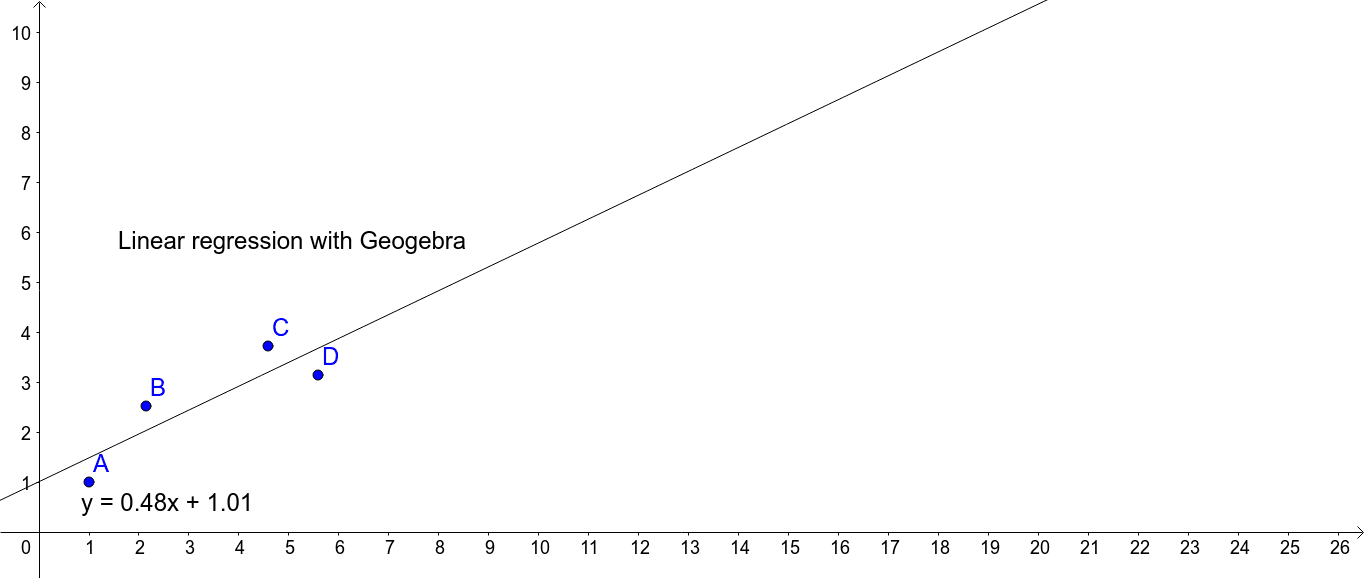
This example demonstrates how to fit a line to a set of data points using linear regression, showcasing the process of drawing the regression line. Core math concepts include linear regression, arithmetic mean, difference and slope, reflection, and random experiments. It utilizes the GeoGebra command FitLineY on points A, B, C, D to generate the regression line f and text annotation text1. Suitable for high school and above learners to understand data fitting and linear regression applications.
GeoGebra Commands & Parameters
FitLineY({A, B, C, D}) → f
AI Drawing Prompt Reference
Draw a set of data points A, B, C, and D, and fit a line f using linear regression. Calculate the arithmetic mean of these points, determine the slope and intercept of the line, and then draw the line. Add a comment below the graph explaining the process and result of linear regression.
The prompt above was compiled from the original drawing commands and is for reference only.