
Linear Regression Example 2 by Didier Michel Joomun
Loading the math board and drawing, please wait…
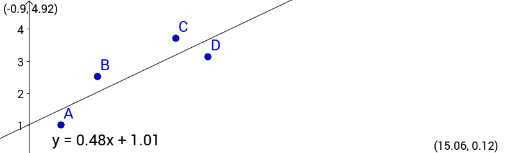
This example demonstrates how to perform linear regression analysis using GeoGebra, plotting data points and fitting a line. Core math concepts include linear regression, expected value, and statistical diagrams. Key GeoGebra commands used are FitLineY for fitting line f to points A, B, C, D, and text1 for annotation. Suitable for high school and above learners for understanding and practicing data analysis and statistics.
GeoGebra Commands & Parameters
FitLineY({A, B, C, D}) → f