
Linear Rates in Tables, Graphs and Equations
Loading the math board and drawing, please wait…
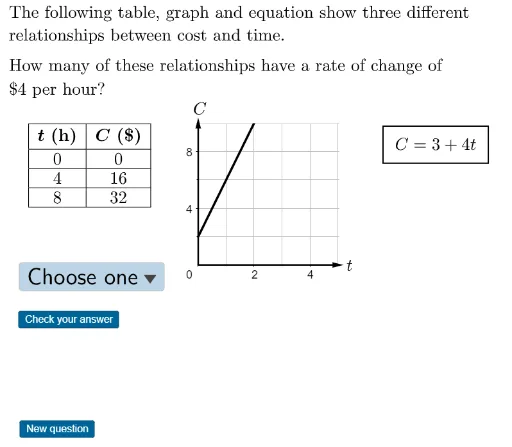
This interactive GeoGebra activity provides practice in identifying rates of change (slopes) from tables, graphs, and equations. It randomly generates linear relationships in different representations, prompting students to extract and compare the rate of change from each. Core mathematical concepts include linear functions, slope, data interpretation from tables, and graph reading. The construction uses GeoGebra commands such as RandomElement to generate random questions, If and Text for conditional logic and labels, Corner and Polygon for visual elements, TableText and Vector for creating tables and arrows, and Append and CountIf for data handling and validation. Objects include multiple variables for tables, graphs, and equations (e.g., tablerates, graphrates, equationrates) along with interactive text elements. Suitable for middle school to high school students learning linear functions, and useful for classroom demonstrations or self-paced practice.
GeoGebra Commands & Parameters
RandomElement(nofoursgraph) → nofourgraphRandomElement(graphrates) → graphrateRandomElement(nofoursequation) → nofourequationRandomElement(equationrates) → equationrateIf(graphrate ≠ 4, 4, nofourgraph) → graphstartIf(equationrate ≠ 4, 4, nofourequation) → equationstartText(If[equationrate < 0, "-", "+"]) → equationsignRandomElement(questionrates) → questionrateCorner(5) → dimsPolygon(A, B, C, D) → q1, a, b, c, dRandomElement(nofourstable) → nofourtableRandomElement(tableleftincs) → tableleftincRandomElement(tablerates) → tablerateIf(tablerate ≠ 4, 4, nofourtable) → tablestartText("C") → B1TableText(Append["\textbf{\(t\) (h)}", Element[tabledata, 1]], Append["\textbf{\(C\) ($)}", Element[tabledata, 2]], "|_vc") → tableVector(G, F) → uVector(G, E) → vAppend("$\textsf{Choose one}$", choices) → userinputCountIf(x ≟ 4, rates) → aaaaaText(If[tableleftinc ≠ 1, "hours", "hour"]) → hours
AI Drawing Prompt Reference
Create an interactive practice graphic for linear rates of change. The scene includes a table with two columns labeled time (hours) and cost (dollars), containing several rows of data. Next to it, a coordinate plane shows a straight line starting from a point, with its slope randomly determined. Below, a linear equation is displayed in the form 'cost = slope × time + intercept', with the slope sign shown as plus or minus. The table, line, and equation all relate to the same rate but may have different values. A polygon area serves as the question background, and a dropdown menu allows answer selection. The layout is clear for classroom use.
The prompt above was compiled from the original drawing commands and is for reference only.