
Linear Programming Demonstration by Mathguru
Loading the math board and drawing, please wait…
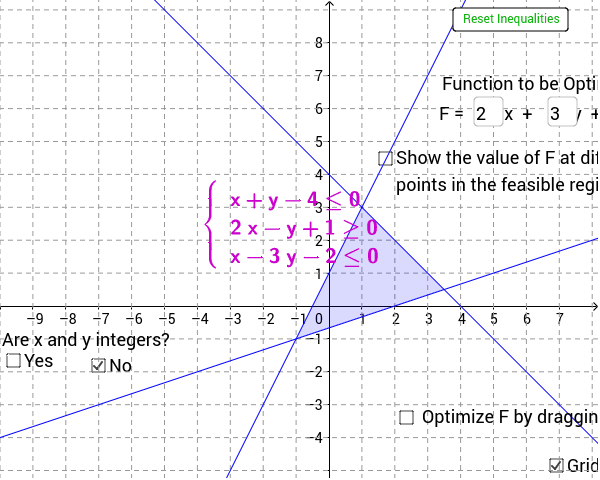
This example demonstrates how to optimize a function under given constraints, involving core concepts like inequalities, function optimization, and coordinate geometry. It is constructed using GeoGebra commands such as PointIn, Textfield, Sequence, and Text, suitable for high school and above learners or educational purposes.
GeoGebra Commands & Parameters
PointIn(sol) → PTextfield(a) → inputBox1Textfield(b) → inputBox2Sequence(Segment[(i, y(Corner[1])), (i, y(Corner[3]))], i, 1, ceil(x(Corner[3]))) → list2Sequence(Segment[(x(Corner[1]), j), (x(Corner[3]), j)], j, 1, ceil(y(Corner[3]))) → list3Sequence(Segment[(x(Corner[1]), -j), (x(Corner[3]), -j)], j, 1, abs(floor(y(Corner[1])))) → list4Sequence(Segment[(-i, y(Corner[1])), (-i, y(Corner[3]))], i, 1, abs(floor(x(Corner[1])))) → list5Textfield(c) → inputBox3Text(LaTeX["\left \{ \begin{array}{l}\\ " * a1 * "\\ " * a2 * "\\ " * a3 * "\\\end{array}\right.", true], A, true, true) → sys
AI Drawing Prompt Reference
Draw a coordinate system with a shaded region defined by inequalities and mark the optimal point within it. Include input boxes for setting inequality parameters, extend background grid lines from the origin in all four directions, and display the text of the inequality system.
The prompt above was compiled from the original drawing commands and is for reference only.