
Linear Model Example: Home Size vs. Cost
Loading the math board and drawing, please wait…
In collections
UCSS Secondary Math I Unit 4 Lesson 3
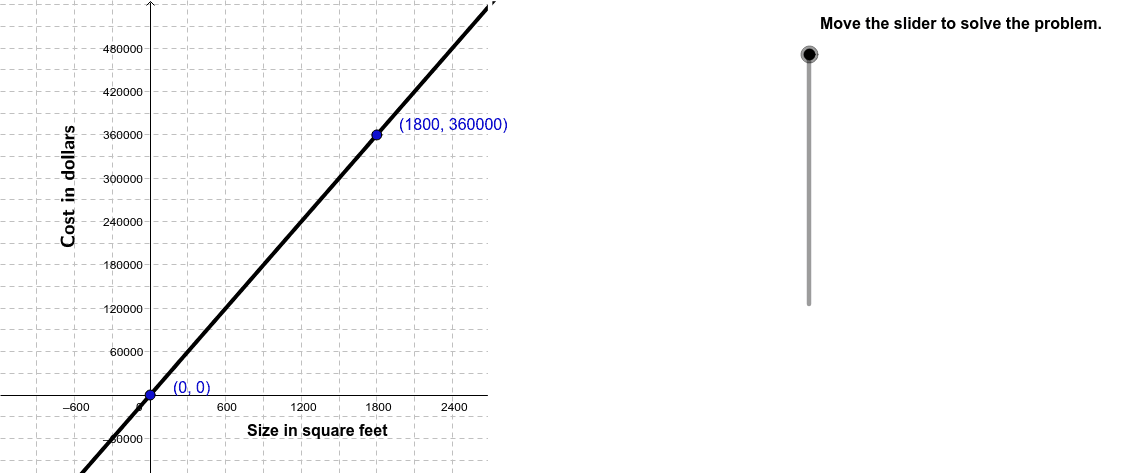
This example demonstrates how to create a linear model that approximates the relationship between the size of a home and its cost, including graphing the function. Key math concepts involve linear functions, slope, intercept, coordinate geometry, and vector operations. GeoGebra commands used include Point, Intersect, Vector, Polygon, and VerticalText for constructing the model and visualizing the data. Suitable for high school mathematics students and teachers learning about linear regression and function graphing.
GeoGebra Commands & Parameters
Point(f) → P_1Point(f) → P_2Intersect(f, xAxis, 1) → DVector(C, D) → uPolygon((2700, y(Corner[2])), Corner[2], Corner[3], (2700, y(Corner[4]))) → poly1, a, c, d, eVerticalText("\text{Cost in dollars}") → text2
AI Drawing Prompt Reference
Create a linear model graph showing the relationship between home size and cost. Start by drawing a straight line representing the function on a coordinate plane. Place two points on this line to indicate sample data. Find the intersection of the line with the horizontal axis, and from that intersection draw a vector pointing to another known point. Then, construct a vertical rectangular region on the right side of the graph using a polygon, representing the cost range. Finally, add vertical text next to this rectangle that reads "Cost in dollars". The overall figure should clearly display the linear trend, the intersection, the vector, and the labeled region.
The prompt above was compiled from the original drawing commands and is for reference only.