
Linear Inequalities y≤,≥ mx + b
Loading the math board and drawing, please wait…
In collections
Geom. & Alg.: Systems Equations & Linear Programming
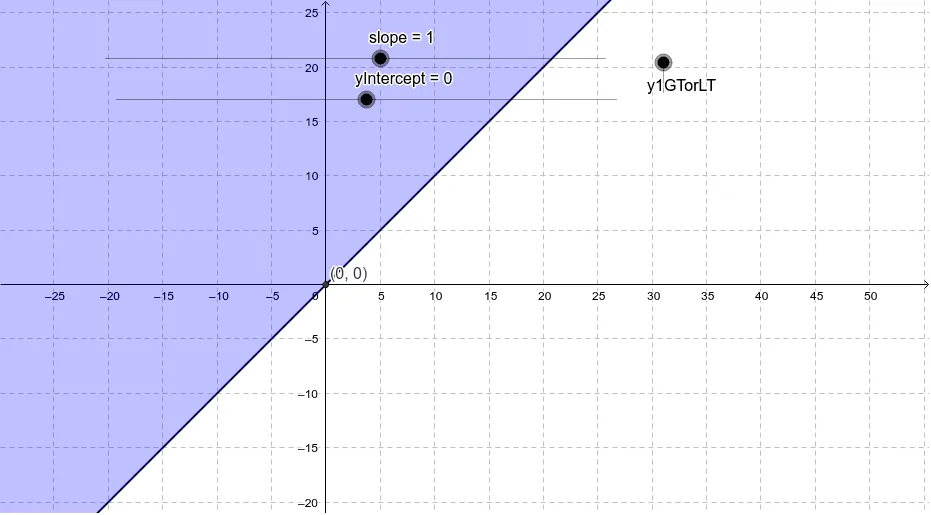
This example demonstrates linear inequalities, involving the core mathematical concepts of linear functions and inequalities. Using GeoGebra commands like Intersect, the intersection points between the linear function y1 and the inequality y1GTorLT are constructed. Suitable for students at the junior high school level and above to learn about linear functions and inequalities.
GeoGebra Commands & Parameters
Intersect(y1, yAxis) → A
AI Drawing Prompt Reference
Draw the line y = 2x + 1 and find its intersection with the x-axis. Then, draw the region where y is less than or equal to 2x + 1. First, plot the line y = 2x + 1, then locate its intersection with the x-axis, and finally shade the area where y is less than or equal to 2x + 1.
The prompt above was compiled from the original drawing commands and is for reference only.