
Linear Inequalities y ≤,≥ mx + b: Graph and Half-Plane Solution Sets
Loading the math board and drawing, please wait…
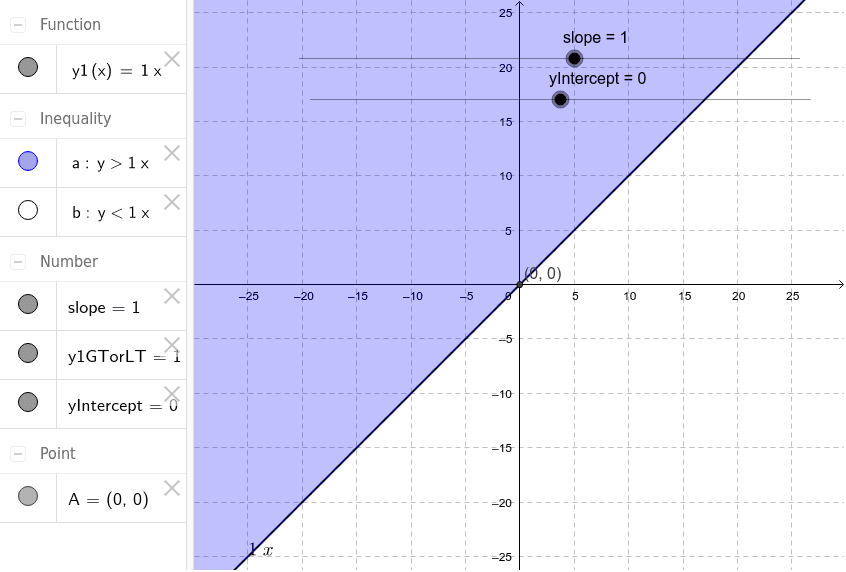
This GeoGebra example demonstrates the graph of the linear boundary line y = mx + b and the half-plane regions above or below it, visualizing the solution sets of the two-variable linear inequalities y ≤ mx + b and y ≥ mx + b. Key mathematical concepts include linear function graphs, slope and y-intercept, boundary lines (solid for inclusive, dashed for strict), and shaded half-plane solution sets. The construction relies on the GeoGebra command Intersect with objects such as slope, yIntercept, y1, y1GTorLT, parameters a and b, and point A to dynamically control the line and inequality shading. It is suitable for middle and high school algebra instruction, function graphing lessons, and interactive exploration of inequality solution sets.
GeoGebra Commands & Parameters
Intersect(y1, yAxis) → A