
Linear Inequalities Interactive Demonstration
Loading the math board and drawing, please wait…
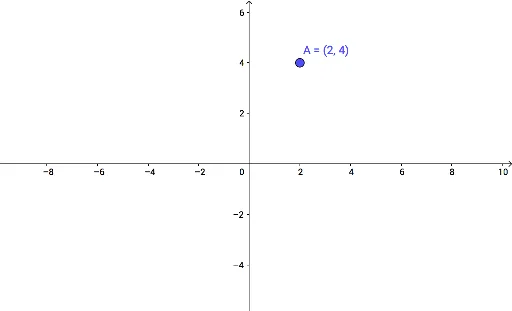
① This GeoGebra example interactively demonstrates the graphical representation of linear inequalities, allowing users to drag point A or adjust parameters to see how the solution region and boundary line change in real time. ② Core mathematical concepts include linear inequalities, solution sets, boundary lines, slope and intercept, and how the inequality sign affects the shaded region. ③ Construction highlights: from the summary, it uses Textfield for user input of the inequality, If for conditional shading based on the inequality sign, and Line for drawing the boundary; objects include point A, lines f/g, inequality regions ls/rs, texts text1-text5, button1, and size controls, all providing dynamic feedback through interactive widgets. ④ Suitable for middle and high school students learning algebra and coordinate geometry, as well as teachers demonstrating the geometric meaning of inequality solution sets in class, supporting foundational concepts of linear programming.
GeoGebra Commands & Parameters
Textfield(f) → lsTextfield(g) → rsIf(f(A_x, A_y) > g(A_x, A_y), ">", If[f(A_x, A_y) ≟ g(A_x, A_y), "=", "<"]) → ineqIf(rel ≟ 1, f(x, y) < g(x, y), rel ≟ 2, f(x, y) ≤ g(x, y), rel ≟ 3, f(x, y) ≥ g(x, y), f(x, y) > g(x, y)) → dLine(B, C) → h