
Linear Inequalities by Mark Beckwith
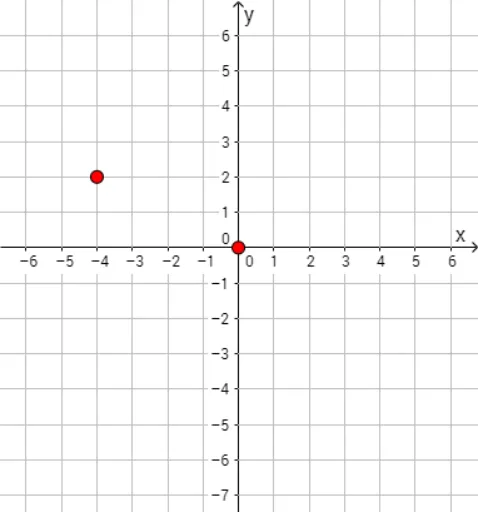
Loading the math board and drawing, please wait…
This example demonstrates the representation of the solution set of linear inequalities in a coordinate system. Key math concepts include linear inequalities, region representation, and boundary lines. Construction highlights involve commands/objects like Textfield, Line, button1, i, a, c, list1, m_1, list2, b_1, d, e, g, f, m_2, b_2, list3, list4, h, j, k, l, text1, text2, text3, text4, b, m, InputBox1, InputBox2, n, o, p, q, r, s, t, u, text5, v, w, f_1 from GeoGebra. Suitable for high school students learning linear programming basics.
GeoGebra Commands & Parameters
Textfield(m) → InputBox1Textfield(b) → InputBox2Line(A, B) → g_1Line(A, B) → h_1
AI Drawing Prompt Reference
Draw a coordinate plane with two boundary lines representing linear inequalities. Place an input box near each line to adjust its slope and intercept. Shade the half-plane on one side of each line with semi-transparent color, and highlight the overlapping shaded region in a darker tone to show the intersection of solution sets. Include axes, grid lines, and intersection points for clarity.
The prompt above was compiled from the original drawing commands and is for reference only.