
Linear Functions Quiz
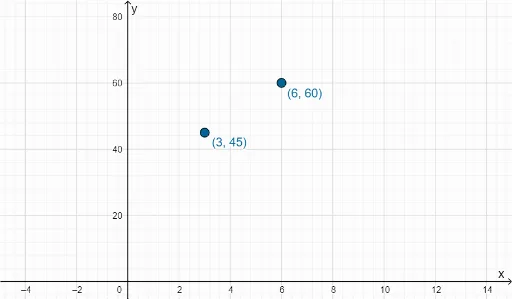
Loading the math board and drawing, please wait…
This example demonstrates the graphing and analysis of linear functions, involving core concepts like linear functions, matrices, statistical characteristics, parabolas, tangent lines, and median values. It utilizes GeoGebra commands such as RandomElement, Random, Min, Max, and Textfield, along with objects like mlist, m, c, and f to construct interactive problems and function images. Suitable for high school mathematics education, focusing on function graph understanding and data analysis.
GeoGebra Commands & Parameters
RandomElement(mlist) → mRandom(-20, 30) → cRandom(-3, 3) → aRandom(4, 10) → bRandomElement(qlist) → qMin({f(-4), f(11), -5}) → yminMax({f(-4), f(11), 10}) → ymaxTextfield(stname) → InputBox5Textfield(g) → InputBox2Textfield(inpq1) → InputBox1Textfield(inpq3) → InputBox3Textfield(inpq4) → InputBox4
AI Drawing Prompt Reference
Create a graph of a linear function with randomly generated slope and y-intercept, showing the function plot, minimum and maximum values, and statistical characteristics related to median values, while adding text boxes for input and display of problems, suitable for high school mathematics education focusing on function graph understanding and data analysis.
The prompt above was compiled from the original drawing commands and is for reference only.