
Linear Function Graphing Example
Loading the math board and drawing, please wait…
In collections
CCSS Support Math II Unit 2
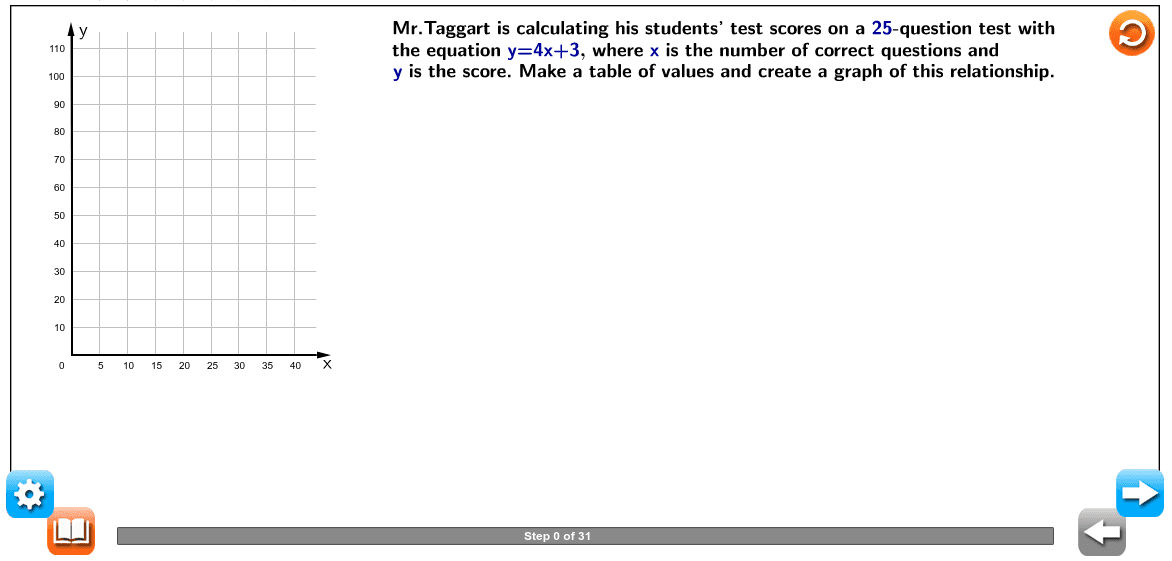
This example demonstrates how to graph the linear function y=4x+3 using GeoGebra, highlighting its intersection with axes and slope characteristics. Core math concepts include linear functions, slope, y-intercept, coordinate system, and function graphing. Construction involves commands/objects like Polygon, Point, Segment, Vector, LaTeX, VerticalText, and TableText as per the summary. Suitable for middle school and above students learning function graphing, linear function properties, and GeoGebra usage.
GeoGebra Commands & Parameters
Polygon(A, B, C, D) → poly1, a, b, c, dPoint(a) → FPolygon(E, A, F, G) → poly2, e, a_1, f, gPoint(yAxis) → HSegment(H, I) → hPoint(xAxis) → JSegment(I, J) → iPoint(yAxis) → KPoint(yAxis) → LPoint(xAxis) → MVector(K, M) → vLaTeX("\text{Determine values that make the equation true.}") → text1_3LaTeX("\text{Given equation}") → text1_{11}LaTeX("\text{Substitute \textcolor{#000099}{0} for \textcolor{#000099}{x}.}") → text1_{18}LaTeX("\text{Simplify.}") → text1_{19}LaTeX("\text{Given equation}") → text1_{20}LaTeX("\text{Simplify.}") → text1_{22}LaTeX("\text{Given equation}") → text1_{23}LaTeX("\text{Simplify.}") → text1_{34}LaTeX("\text{Substitute \textcolor{#000099}{10} for \textcolor{#000099}{x}.}") → text1_{26}LaTeX("\text{Given equation}") → text1_{36}LaTeX("\text{Simplify.}") → text1_{40}LaTeX("\text{Organize these values in a table.}") → text1_6LaTeX("\text{\textcolor{#000099}{x}-values in one column and \textcolor{#000099}{y}-values in the other. }") → text1_{31}LaTeX("\text{Plot the ordered pairs from the table on a coordinate plane. }") → text1_{32}LaTeX("\text{Plot these ordered pairs on a coordinate plane. }") → text1_{42}LaTeX("\text{Label the \textcolor{#000099}{x}-axis “Number of correct questions” and the }") → text1_{43}LaTeX("\text{Number of correct questions}") → text1_{45}LaTeX("\text{Draw a line through the points. }") → text1_{46}LaTeX("\text{through the plotted points. }") → text1_{48}LaTeX("\text{ start at \textcolor{#000099}{x = 0} and end at \textcolor{#000099}{x = 25}. }") → text1_{51}LaTeX((("\text{Substitute \textcolor{#000099}{" * x1_1) * "} for \textcolor{#000099}{x} and solve for \textcolor{#000099}{y}. }")) → text1_9LaTeX((("\text{Substitute \textcolor{#000099}{" * x3_1) * "} for \textcolor{#000099}{x} and solve for \textcolor{#000099}{y}. }")) → text1_{27}LaTeX((("\text{Substitute \textcolor{#000099}{" * x4_1) * "} for \textcolor{#000099}{x} and solve for \textcolor{#000099}{y}. }")) → text3Polygon(R, S, T, U) → poly3, r, s, t, uVerticalText("\text{Score}") → text10Vector(K, V) → wLaTeX("\text{The solutions to the linear equation are the infinite set of points on the line. }") → text11_5Polygon(W, Z, A_1, B_1) → poly4, w_1, z_1, a_2, b_1LaTeX("\text{x}") → text12LaTeX("\text{y}") → text12_1LaTeX((((("\text{\textcolor{#000099}{y =" * c1) * "x + ") * c2) * "}}")) → text1_{13}LaTeX((((((("\text{\textcolor{#000099}{y = " * c1) * "(") * x1_1) * ") + ") * c2) * "}}")) → text1_{12}LaTeX((("\text{\textcolor{#000099}{y = " * sol1) * "}}")) → text1_{10}LaTeX((((("\text{\textcolor{#000099}{y = " * c1) * "x + ") * c2) * "}}")) → text1_{15}LaTeX((((((("\text{\textcolor{#000099}{y = " * c1) * "(") * x2) * ") + ") * c2) * "}}")) → text1_{16}LaTeX((("\text{\textcolor{#000099}{y = " * sol2) * "}}")) → text1_{17}LaTeX((((("\text{\textcolor{#000099}{y =" * c1) * "x + ") * c2) * "}}")) → text1_{14}LaTeX((((((("\text{\textcolor{#000099}{y = " * c1) * "(") * x3_1) * ") + ") * c2) * "}}")) → text1_{24}LaTeX((("\text{\textcolor{#000099}{y = " * sol3) * "}}")) → text1_{25}LaTeX((((("\text{\textcolor{#000099}{y =" * c1) * "x + ") * c2) * "}}")) → text1_{35}LaTeX((((((("\text{\textcolor{#000099}{y = " * c1) * "(") * x4_1) * ") + ") * c2) * "}}")) → text1_{37}LaTeX((("\text{\textcolor{#000099}{y = " * so4) * "}}")) → text1_{38}LaTeX((((("\text{and \textcolor{#000099}{(" * x4_1) * ",") * so4) * ")}. }")) → text1_{41}LaTeX((("\text{Coefficient of x:" * c1) * "}")) → text5Segment(PO1, PO4) → jLaTeX("\text{Substitute \textcolor{#000099}{1} for \textcolor{#000099}{x}.}") → text1_{21}LaTeX("\text{Substitute \textcolor{#000099}{1} for \textcolor{#000099}{x} and solve for \textcolor{#000099}{y}. }") → text2LaTeX("\text{Substitute \textcolor{#000099}{25} for \textcolor{#000099}{x}.}") → text1_{39}LaTeX((("\text{Constant:" * c2) * "}")) → text5_1TableText({{LaTeX["\mathbf{\;\;\;\;\;x\;\;\;\;\;}"], LaTeX[(("\text{\textcolor{#000099}{" * x1_1) * "}}")], LaTeX["\text{\textcolor{#000099}{1}}"], LaTeX[(("\text{\textcolor{#000099}{" * x3_1) * "}}")], LaTeX[(("\text{\textcolor{#000099}{" * x4_1) * "}}")]}, {LaTeX["\mathbf{\;\;\;\;\;y\;\;\;\;\;}"], LaTeX[(("\text{\textcolor{#000099}{" * sol1) * "}}")], LaTeX[(("\text{\textcolor{#000099}{" * sol2) * "}}")], LaTeX[(("\text{\textcolor{#000099}{" * sol3) * "}}")], LaTeX[(("\text{\textcolor{#000099}{" * so4) * "}}")]}}, "vc_|l") → text4LaTeX("\text{Mr.Taggart is calculating his students’ test scores on a \textcolor{#000099}{25}-question test with}") → text1LaTeX((((("\text{the equation \textcolor{#000099}{y=" * c1) * "x+") * c2) * "}, where \textcolor{#000099}{x} is the number of correct questions and}")) → text1_1LaTeX("\text{\textcolor{#000099}{y} is the score. Make a table of values and create a graph of this relationship.}") → text1_2LaTeX((((((("\text{points, substitute values for \textcolor{#000099}{x} and solve for \textcolor{#000099}{y}. Let’s use the values \textcolor{#000099}{" * x1_1) * ", 1, ") * x3_1) * ",} and \textcolor{#000099}{") * x4_1) * "}. }")) → text1_5LaTeX("\text{To create a graph of the given equation, at least two points are needed. To find the }") → text1_4LaTeX((((("\text{When \textcolor{#000099}{x = " * x1_1) * "}, \textcolor{#000099}{y = ") * sol1) * "}. }")) → text1_7LaTeX((("\text{When \textcolor{#000099}{x = 1}, \textcolor{#000099}{y =" * sol2) * "}. }")) → text1_8LaTeX((((("\text{When \textcolor{#000099}{x = " * x3_1) * "}, \textcolor{#000099}{y = ") * sol3) * "}. }")) → text1_{28}LaTeX((((("\text{When \textcolor{#000099}{x = " * x4_1) * "}, \textcolor{#000099}{y = ") * so4) * "}. }")) → text1_{29}LaTeX("\text{Create a table of the values determined in the previous step, with }") → text1_{30}LaTeX((((((((((("\text{The ordered pairs from the table are \textcolor{#000099}{(" * x1_1) * ", ") * sol1) * "), (1,") * sol2) * "), (") * x3_1) * ",") * sol3) * "),} }")) → text1_{33}LaTeX("\text{\textcolor{#000099}{y}-axis “Score.”}") → text1_{44}LaTeX((((("\text{Since the given equation, \textcolor{#000099}{y = " * c1) * "x + ") * c2) * "}, is a linear equation, draw a line}")) → text1_{47}LaTeX("\text{get from \textcolor{#000099}{0} to \textcolor{#000099}{25} answers correct. Therefore, the line must }") → text1_{50}LaTeX("\text{Because there are only \textcolor{#000099}{25} questions on the test, a student could }") → text1_{49}LaTeX("\text{\mathbf{quadratic\; function} a function that can be written in the form \textcolor{#000099}{f(x)=ax^2+bx+c}, }") → text11LaTeX("\text{where \textcolor{#000099}{a≠0}. The graph of any quadratic function is a parabola.}") → text11_1LaTeX("\text{\mathbf{linear\; equation} an equation that can be written in the form \textcolor{#000099}{ax+by=c}, }") → text11_2LaTeX("\text{ in which \textcolor{#000099}{m} is the slope, \textcolor{#000099}{b} is the \textcolor{#000099}{y}-intercept, and the graph is a straight line. }") → text11_4LaTeX("\text{where \textcolor{#000099}{a, \, b,} and \textcolor{#000099}{c} are rational numbers; can also be written as \textcolor{#000099}{ y=mx+b}, }") → text11_3
AI Drawing Prompt Reference
Draw the graph of the linear function y=4x+3, highlighting its intersection with the axes and showcasing its slope and y-intercept characteristics. Use polygons and vectors to represent the slope, and mark key points such as the intersection of the function graph with the x-axis and y-axis. Display the corresponding y-values for different x-values in a table and plot these points on the coordinate plane, then connect them with a line to form the function graph.
The prompt above was compiled from the original drawing commands and is for reference only.