
Linear Function Graphing and Properties
Loading the math board and drawing, please wait…
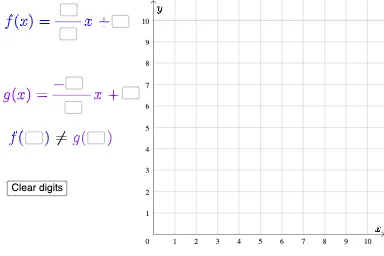
This example demonstrates how to draw linear function graphs using GeoGebra, highlighting key concepts such as slope and intercept. Construction involves commands like Textfield, If, Mode, and objects such as a, b, c, f. Suitable for middle or high school students to understand linear function properties and graphing techniques.
GeoGebra Commands & Parameters
Textfield(a) → a1Textfield(b) → a2Textfield(c) → a3Textfield(f) → a4Textfield(g) → a5Textfield(j) → a6If(h(l) ≟ p(m), "=", "≠") → text6Textfield(l) → a7Textfield(m) → a8Mode(l1) → l2If(Length[l2] ≟ 0, "No repeated digits!", "Repeated digits exist.") → b1
AI Drawing Prompt Reference
Draw a linear function graph with slope, intercept, and coordinate axes. Ensure the line intersects the axes and labels key points. The construction order should start with the axes, then add the line, and finally label the slope and intercept.
The prompt above was compiled from the original drawing commands and is for reference only.