
Linear Function Graph Example
Loading the math board and drawing, please wait…
In collections
CCSS Support Algebra I Unit 3
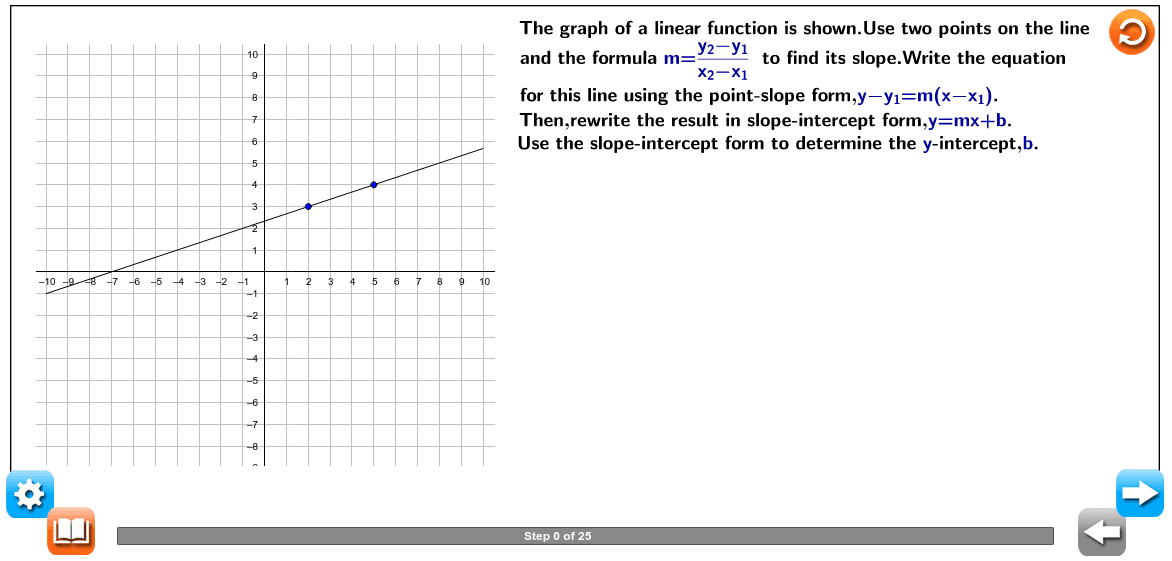
This example demonstrates the graph of a linear function. By selecting two points on the line, the slope is calculated using the formula [math]m=
rac{y_2-y_1}{x_2-x_1}[/math], and the equation of the line is written. Commands used include SelectedElement, Polygon, LaTeX, Segment, Division, FractionText, etc. Suitable for middle school and above students to learn about linear functions.
GeoGebra Commands & Parameters
SelectedElement(FXX) → FXXVSelectedElement(FXC) → FXCVSelectedElement(GXX) → GXXVSelectedElement(GXC) → GXCVPolygon(H, I, J, K) → poly1, h, i, j, kLaTeX("\text{Determine the slope of the line.}") → text14LaTeX("\text{into the slope formula.}") → text18LaTeX("\text{Use the point-slope form to write the equation for this line.}") → text25LaTeX("\text{to write the point-slope form of this line.}") → text29LaTeX("\text{in the point-slope form.}") → text31LaTeX("\text{Rewrite the equation in slope-intercept form.}") → text38LaTeX("\text{of the equation.}") → text53Segment(R, T) → aLaTeX("\text{x₁:}") → DKT1LaTeX("\text{y₁:}") → DKT2LaTeX("\text{x₂:}") → DKT3LaTeX("\text{y₂:}") → DKT4LaTeX("\text{The graph of a linear function is shown.Use two points on the line") → text1LaTeX("\text{for this line using the point-slope form,\textcolor{#000099}{y−y₁=m(x−x₁)}.}") → text11LaTeX("\text{Then,rewrite the result in slope-intercept form,\textcolor{#000099}{y=mx+b}.}") → text12LaTeX("\text{Use the slope-intercept form to determine the \textcolor{#000099}{y}-intercept,\textcolor{#000099}{b}.}") → text13LaTeX("\text{Use two points on the line to determine the slope.Two easily identifiable}") → text15LaTeX((((((((("\text{points on the line are \textcolor{#000099}{(" * FXXV) * ", ") * FXCV) * ")} and \textcolor{#000099}{(") * GXCV) * ", ") * GXXV) * ")}.}")) → text16LaTeX((((((((("\text{Let \textcolor{#000099}{(x₁,y₁)} be \textcolor{#000099}{(" * FXXV) * ", ") * FXCV) * ")} and \textcolor{#000099}{(x₂,y₂)} be \textcolor{#000099}{(") * GXCV) * ", ") * GXXV) * ")}.Substitute these values}")) → text17LaTeX((((((((("\text{\textcolor{#000099}{m=}}{\textcolor{#000099}{\frac{(" * GXXV) * ")−(") * FXCV) * ")}{(") * GXCV) * ")−(") * FXXV) * ")}}}")) → text20LaTeX((((((("\text{Substitute \textcolor{#000099}{" * GXXV) * "} for \textcolor{#000099}{y₂},\textcolor{#000099}{") * FXCV) * "} for \textcolor{#000099}{y₁},\textcolor{#000099}{") * GXCV) * "} for \textcolor{#000099}{x₂},}")) → text21LaTeX((("\text{and \textcolor{#000099}{" * FXXV) * "} for \textcolor{#000099}{x₁}.}")) → text22LaTeX((((("\text{The given line has a slope of }{\textcolor{#000099}{\frac{" * numupdate) * "}{") * denupdate) * "}}.}")) → text24LaTeX("\text{The point-slope form of a linear function is \textcolor{#000099}{y−y₁=m(x−x₁)},where}") → text26LaTeX("\text{\textcolor{#000099}{m} is the slope and \textcolor{#000099}{(x₁,y₁)} is a point on the line.}") → text27LaTeX((((((((("\text{Substitute the point \textcolor {#000099} {(" * FXXV) * ",") * FXCV) * ")} for \textcolor{#000099}{(x₁,y₁)} and substitute the slope }\textcolor{#000099}{{\frac{") * numupdate) * "}{") * denupdate) * "}}}\text{ for \textcolor{#000099}{m}}")) → text30LaTeX("\text{\textcolor{#000099}{y−y₁=m(x−x₁)} Point-slope form}") → text32LaTeX((((((((("\text{The equation of the line in point-slope form is \textcolor{#000099}{y−" * FXCV) * "={ \frac{") * numupdate) * "}{") * denupdate) * "}}(x−") * FXXV) * ")}.}")) → text37LaTeX("\text{The slope-intercept form of a linear function is \textcolor{#000099}{y=mx+b},where \textcolor{#000099}{m} is}") → text39LaTeX("\text{the slope and \textcolor{#000099}{b} is the \textcolor{#000099}{y}-intercept.}") → text40LaTeX("\text{the equation for \textcolor{#000099}{y} and simplify.}") → text42LaTeX("\text{Determine the \textcolor{#000099}{y}-intercept of the line.}") → text47LaTeX("\text{This equation is in slope-intercept form,\textcolor{#000099}{y = mx + b},where \textcolor{#000099}{m}\ is the}") → text49LaTeX("\text{slope and \textcolor{#000099}{b} is the \textcolor{#000099}{y}-intercept.}") → text50LaTeX("\text{\textcolor{#000099}{m=}}{\textcolor{#000099}{\frac{y₂−y₁}{x₂−x₁}}}{\text{ Slope formula}}") → text19LaTeX((((((((("\text{The \textcolor{#000099}{y}-intercept can be determined from the equation}\textcolor{#000099}{\text{ y=} {\frac{" * numupdate) * "}{") * denupdate) * "}}\text{x+{\frac{") * ssimpnum) * "}{") * denupdate) * "}}}.}")) → text48LaTeX((((((((("\text\textcolor{#000099}{{y=} {\frac{" * numupdate) * "}{") * denupdate) * "}}\text{x+{\frac{") * ssimpnum) * "}{") * denupdate) * "}}}}")) → text45LaTeX((("\text{Add \textcolor{#000099}{" * FXCV) * "} to both sides to isolate \textcolor{#000099}{y}.}")) → text45_1LaTeX((((((("\text{Distribute\textcolor{#000099}{{ \frac{" * numupdate) * "}{") * denupdate) * "}}} \text{over \textcolor{#000099}{x−") * FXXV) * "}.}}")) → text441LaTeX((((((((((("\text{\textcolor{#000099}{{y−" * FXCV) * "=} { \frac{") * numupdate) * "}{") * denupdate) * "}}\text{x−{\frac{") * simpnum) * "}{") * denupdate) * "}}}}")) → text44LaTeX("\text{Point-slope form of the line}") → text431LaTeX((((((((("\text{\textcolor{#000099}{{y−" * FXCV) * "=} { \frac{") * numupdate) * "}{") * denupdate) * "}}\text{(x−") * FXXV) * ")}}")) → text43LaTeX("\text{Simplify.}") → text361LaTeX((((((((("\text{\textcolor{#000099}{y−" * FXCV) * "={ \frac{") * numupdate) * "}{") * denupdate) * "}}(x−") * FXXV) * ")}}")) → text36LaTeX("\text{Simplify.}") → text231LaTeX((((("\text{\textcolor{#000099}{m=}}{\textcolor{#000099}{\frac{" * numupdate) * "}{") * denupdate) * "}}}")) → text23LaTeX((((((((((((("\text{Use either one of the points,\textcolor{#000099}{(" * FXXV) * ",") * FXCV) * ")} or \textcolor{#000099}{(") * GXCV) * ",") * GXXV) * ")},along with the slope,}{\textcolor{#000099}{\frac{") * numupdate) * "}{") * denupdate) * "}},}")) → text28LaTeX((((((((("\text{\textcolor{#000099}{y−(" * FXCV) * ")={\left( \frac{") * numupdate) * "}{") * denupdate) * "} \right)}[x−(") * FXXV) * ")]}}")) → text33LaTeX((((((((("\text{To write the equation \textcolor{#000099}{y−" * FXCV) * "={ \frac{") * numupdate) * "}{") * denupdate) * "}}(x−") * FXXV) * ")}}\text{ in slope-intercept form,solve}")) → text41Division(ssimpnum, denupdate) → checkfrac1FractionText(displayfrac) → text54FractionText(displayfrac) → text55LaTeX((("\text{the \textcolor{#000099}{y}-axis at approximately \textcolor{#000099}{" * Element[checkfrac1, 1]) * "} ,so this verifies the slope‑intercept form}")) → text52LaTeX((((((("\text{Substitute \textcolor{#000099}{" * FXCV) * "} for \textcolor{#000099}{ y₁},}{\textcolor{#000099}{\frac{") * numupdate) * "}{") * denupdate) * "}}\text{for \textcolor{#000099}{m},}")) → text34LaTeX((("\text{and \textcolor{#000099}{" * FXXV) * "} for \textcolor{#000099}{x₁}.}")) → text35LaTeX("\text{method,draw a line using only two points on the coordinate plane.}") → text3LaTeX((((((((("\text{The equation of the line in slope-intercept form is}\textcolor{#000099}{\text{ y=} {\frac{" * numupdate) * "}{") * denupdate) * "}}\text{x+{\frac{") * ssimpnum) * "}{") * denupdate) * "}}.}")) → text46LaTeX((((((("\text{The \textcolor{#000099}{y}-intercept is \textcolor{#000099}{{\frac{" * ssimpnum) * "}{") * denupdate) * "}}},or \textcolor{#000099}{") * Element[checkfrac1, 1]) * "} .Note that on the graph the line crosses}")) → text51Polygon(U, V, W, Z) → poly2, u_1, v_1, w, z_1Polygon(B_1, C_1, D_1, E_1) → poly3, b_1, c_1, d_1, e_1LaTeX("\text{\mathbf{Slope}-\mathbf{intercept\;method} the method used to graph a linear equation;with this }") → text2LaTeX("\text{\mathbf{\textcolor{#000099}{y}}-\mathbf{intercept} the point at which the graph crosses the \textcolor{#000099}{y}-axis;written as \textcolor{#000099}{(0, y)}.}") → text4
AI Drawing Prompt Reference
Draw a linear function graph by selecting two points on the line to determine the slope m = (y₂ - y₁) / (x₂ - x₁). Use the point-slope form y - y₁ = m(x - x₁) to write the equation of the line, and then convert it to the slope-intercept form y = mx + b. First, choose two points on the line, calculate the slope, and then use the point-slope form to write the equation of the line, finally simplify it to the slope-intercept form.
The prompt above was compiled from the original drawing commands and is for reference only.