
Linear Function Exploration
Loading the math board and drawing, please wait…
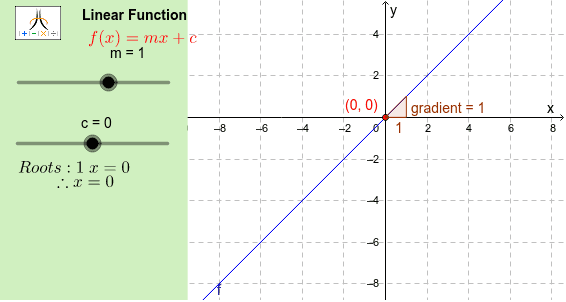
This example demonstrates the graph of linear functions and how their gradients and intercepts change. Key math concepts include linear functions, slope, intercepts, parametric curves, and coordinate geometry. GeoGebra commands like CompleteSquare, Extremum, Root, Factors, Element, Corner, Polygon, and Slope are used, along with objects such as c, m, f, CompSq, TP, text3, xints_1, xints_2, fctrs, and more. It is suitable for high school mathematics education and function graph analysis.
GeoGebra Commands & Parameters
CompleteSquare(f) → CompSqExtremum(f) → TPRoot(f) → xints_1, xints_2Factors(f) → fctrsElement(fctrs, 1, 1) → fctr1Element(fctrs, 2, 1) → fctr2Element(fctrs, 3, 1) → fctr3Corner(1, 1) → Cnr1Corner(1, 2) → Cnr2Corner(1, 3) → Cnr3Corner(1, 4) → Cnr4Polygon(CN1, CN2, CN3, CN4) → Panel, cn1, cn2, cn3, cn4Polygon(Cnr1, Cnr2, Cnr3, Cnr4) → Frame, cnr1, cnr2, cnr3, cnr4Slope(a) → gradient
AI Drawing Prompt Reference
Draw the graph of a linear function to demonstrate how its slope and intercepts change, including parametric curves and coordinate geometry. Plot the function, find its vertex and roots, then factor the function and extract its factors. Construct polygons using these factors and the vertex to create both an inner and outer frame, and label the slope.
The prompt above was compiled from the original drawing commands and is for reference only.