
Linear Function Coefficients and Graph Transformations
Loading the math board and drawing, please wait…
In collections
Algebra 1
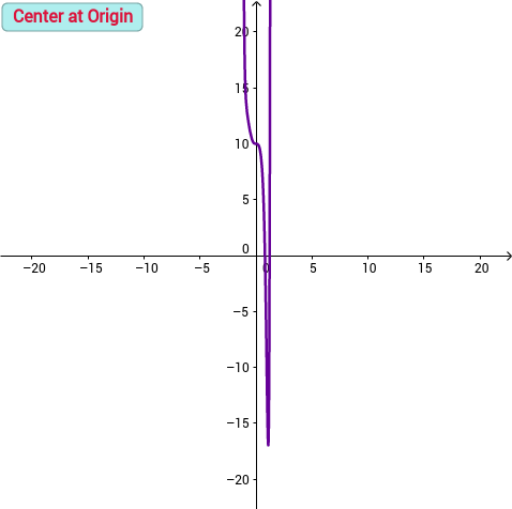
This example demonstrates how changing the coefficients of a linear function affects its graph, particularly by adjusting coefficient 'a' via a slider to observe changes in the graph's orientation and axis of symmetry. Key math concepts include linear functions, coefficients, axis of symmetry, and graph transformations. GeoGebra commands/objects like a, b, c, d, e, g, f, h, i, j, k, l, m, button1, sliders are used to create interactive function graphs. Suitable for middle school students and above to learn function properties and graph transformations, or for introductory calculus education.
GeoGebra Commands & Parameters
Numeric a(9)Numeric b(-8)Numeric c(-5)Numeric d(3)Numeric e(-1)Numeric g(-7)Numeric f(-8)Numeric h(2)Numeric i(-4)Numeric j(-10)Numeric k(2)Numeric l(7)Numeric m(7)Numeric n_{12}(12)Numeric n_{11}(0)Numeric n_{10}(10)Numeric n_{9}(9)Numeric n_8(8)Numeric n_7(7)Numeric n_6(6)Numeric n_5(0)Numeric n_4(4)Numeric n_3(3)Numeric n_2(0)Numeric n_1(0)n(y) = y > 0o(y) = y < 0q(y) = y > 0r(y) = y < 0p(x) = (a * x^(n_{12})) + (b * x^(n_{11})) + (c * x^(n_{10})) + (d * x^(n_{9})) + (e * x^(n_8)) + (f * x^(n_7)) + (g * x^(n_6)) + (h * x^(n_5)) + (i * x^(n_4)) + (j * x^(n_3)) + (k * x^(n_2)) + (l * xPoint A(-0.6944201902476215, -0.5269141691746602)Point B(0.699918500606735, -0.5269141691746602)Point C(-0.6471544719135762, -3.331346790328059)Point D(0.7471842189407802, -3.331346790328059)Point E(-0.6944201902476224, -0.5269141691746589)Point F(0.6999185006067341, -0.5269141691746589)Point G(-0.6471544719135762, -3.331346790328056)Point H(0.7471842189407802, -3.331346790328056){n_1, n_2, n_3, n_4, n_5, n_6, n_7, n_8, n_{9}, n_{10}, n_{11}, n_{12}}Numeric t(0)Numeric u(0){n_1, n_2, n_3, n_4, n_5, n_6, n_7, n_8, n_{9}, n_{10}, n_{11}}{n_1, n_2, n_3, n_4, n_5, n_6, n_7, n_8, n_{9}, n_{10}}{n_1, n_2, n_3, n_4, n_5, n_6, n_7, n_8, n_{9}}{n_1, n_2, n_3, n_4, n_5, n_6, n_7, n_8}{n_1, n_2, n_3, n_4, n_5, n_6, n_7}{n_1, n_2, n_3, n_4, n_5, n_6}{n_1, n_2, n_3, n_4, n_5}{n_1, n_2, n_3, n_4}{n_1, n_2, n_3}{n_1, n_2}{n_1}Numeric s(12)
AI Drawing Prompt Reference
Draw a linear function graph where adjusting coefficient 'a' via a slider changes the graph's orientation and axis of symmetry. Show the function graph, symmetry axis, and key points, with different colors for positive and negative regions.
The prompt above was compiled from the original drawing commands and is for reference only.