
Linear Function and Geometric Construction: Demonstrating Graph, Pythagorean The
Loading the math board and drawing, please wait…
In collections
geometriadinamica.es
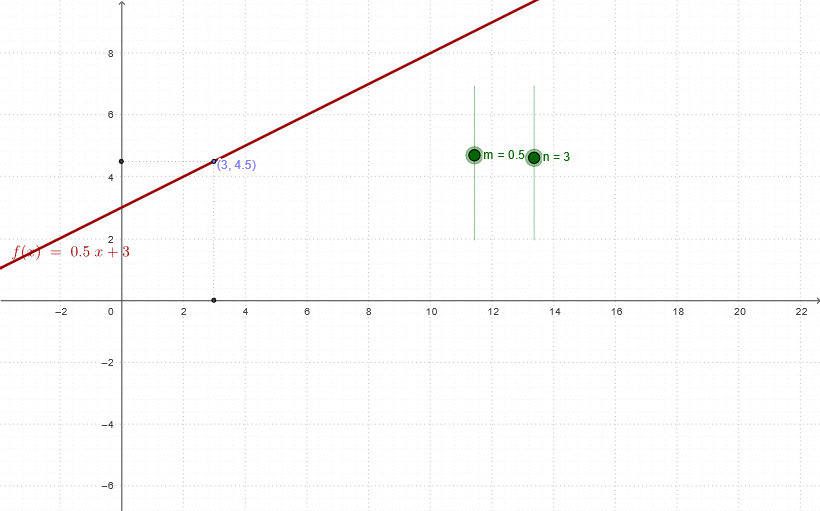
This example demonstrates the graphical representation of linear functions, combined with the Pythagorean theorem, conditional probability, and hyperbola plotting. Key mathematical concepts include function graphing, geometric construction, Pythagorean theorem, and probability statistics. Construction involves GeoGebra commands such as Point, Segment, and Hyperbola to create the figures. Suitable for middle or high school mathematics education, helping students understand the relationship between functions and geometry, as well as visualizing probability and hyperbolas.
GeoGebra Commands & Parameters
Point(f) → ASegment(C, A) → aSegment(A, B) → b
AI Drawing Prompt Reference
Draw a graph of a linear function. Place a moving point on this line. From this point, draw two segments to two fixed points, forming a triangle. Incorporate the Pythagorean theorem by showing the right triangle relationship among the sides. Additionally, plot a hyperbola in the same coordinate system to illustrate the connection between functions and geometric construction. Include visual elements that suggest conditional probability. The overall figure should clearly demonstrate the linear function, geometric construction, hyperbola, and probability concepts for middle or high school math education.
The prompt above was compiled from the original drawing commands and is for reference only.