
Linear Equations: Slope
Loading the math board and drawing, please wait…
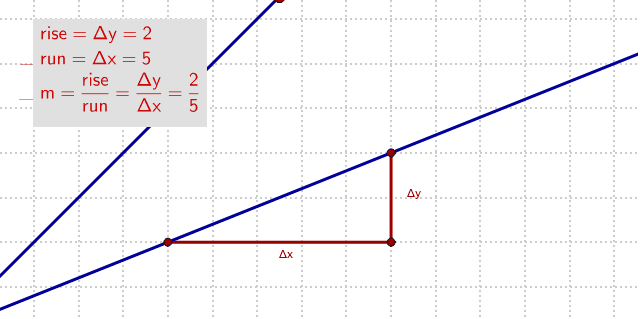
① This example provides an interactive visual representation of the slope of a line, demonstrating how slope is defined as the ratio of vertical change (Δy) to horizontal change (Δx) between two points on the line. ② Core mathematical concepts include linear equations, slope definition, the fact that two points determine a line, and the relationship between slope and the steepness/inclination of the line. ③ Construction details: Using GeoGebra commands such as Point, Line, Ray, Segment, and Intersect, the construction creates key points (A, B), a line, and auxiliary objects like deltay and deltax (vertical and horizontal differences) along with a text label (text1) to display the slope value. Users can drag points to dynamically observe how the slope changes. ④ Suitable for middle school to high school students learning coordinate geometry or function graphing, and for teachers to use in classroom demonstrations to bridge geometric intuition with algebraic slope formulas.
GeoGebra Commands & Parameters
Line(F, xAxis) → bPoint(b) → HRay(F, H) → dPoint(d) → ILine(I, yAxis) → gPoint(g) → JPoint(c_1) → CLine(C, xAxis) → ePoint(e) → GRay(C, G) → aPoint(a) → DLine(D, yAxis) → fIntersect(c_1, f) → ESegment(F, I) → hSegment(I, J) → iLine(F, J) → j
AI Drawing Prompt Reference
On a coordinate plane, draw a horizontal line as the x-axis and mark a point on it as the origin. From the origin, draw a ray along the positive x-axis and place a point on it. Through this point, draw a line parallel to the y-axis, intersecting a given straight line at a point. Then choose another point on the x-axis, draw a ray from it, and place a point on that ray. Through this second point, draw a line parallel to the y-axis, intersecting the same given line at another point. Connect these two intersection points with a segment, and also draw the horizontal and vertical projections of this segment onto the axes, representing the changes in x and y. Finally, draw a line through the two key points and display the slope value as the ratio of vertical change to horizontal change.
The prompt above was compiled from the original drawing commands and is for reference only.