
Line of Symmetry of a Quadratic
Loading the math board and drawing, please wait…
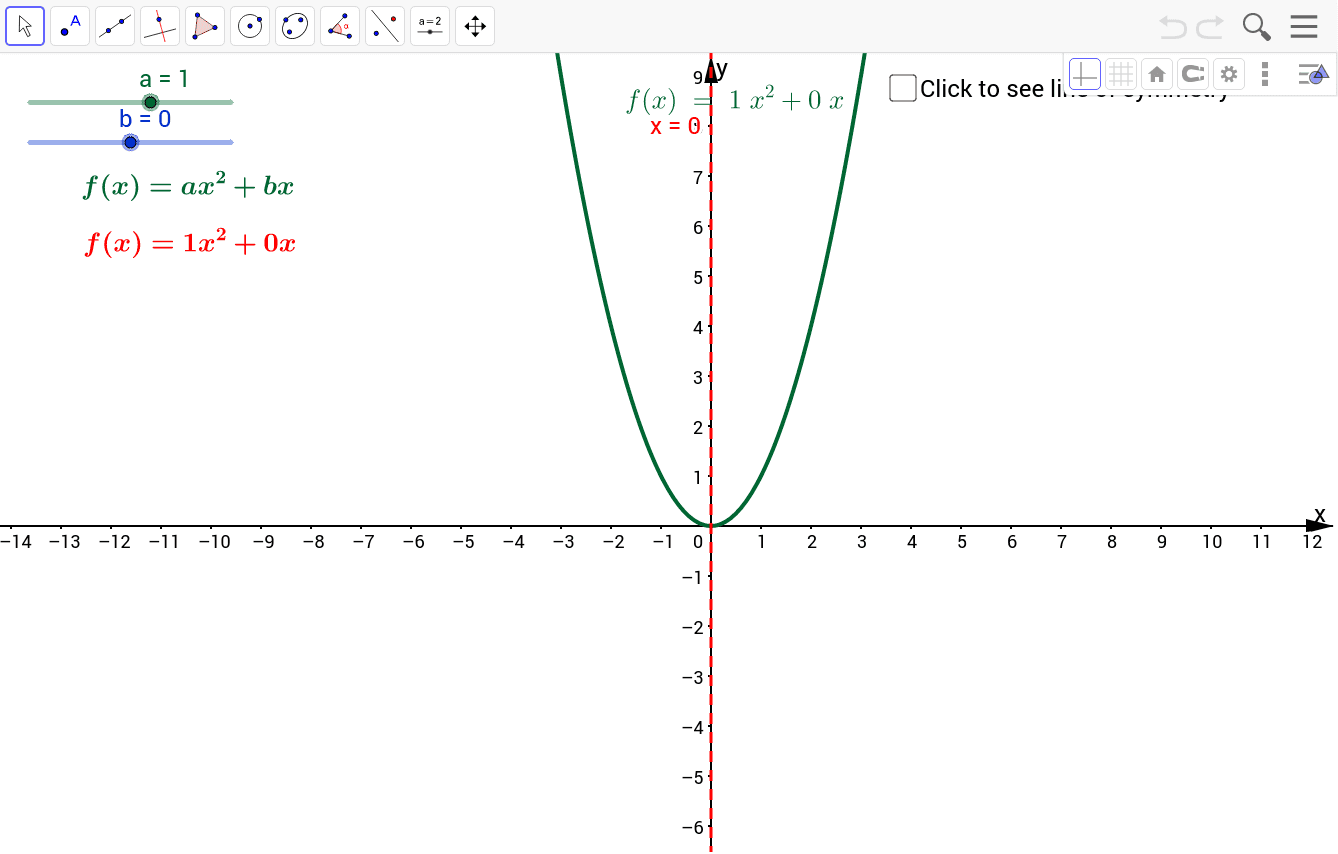
This example demonstrates the line of symmetry of a quadratic function and its properties. Key math concepts include quadratic functions, symmetry axis, vertex coordinates, and analytical geometry. It is constructed using GeoGebra commands/objects like a, b, f, h, text1, text2, text3, text4, c, text5 to plot the quadratic graph, vertex, symmetry axis, and related text annotations. Suitable for high school mathematics teaching to understand the characteristics and symmetry of quadratic function graphs.
GeoGebra Commands & Parameters
Numeric a(1)Numeric b(0)f(x) = (a * x^(2)) + (b * x)x = ((-b)) / ((2 * a))Boolean c(false)
AI Drawing Prompt Reference
Draw a quadratic function graph of the form y = a*x^2 + b*x, with a set to 1 and b set to 0, resulting in an upward-opening parabola with its vertex at the origin. Mark the axis of symmetry as a vertical dashed line passing through the vertex, given by x = -b/(2a), which here is x = 0. Label the vertex coordinates and add text annotations explaining that this axis divides the parabola into two symmetric halves. Also include a toggleable boolean indicator to control the visibility of the symmetry axis, but by default it is hidden. The overall graph should clearly illustrate the symmetry properties of the quadratic function.
The prompt above was compiled from the original drawing commands and is for reference only.