
Sketching Derivatives by D.Jayaseelan (2)
Loading the math board and drawing, please wait…
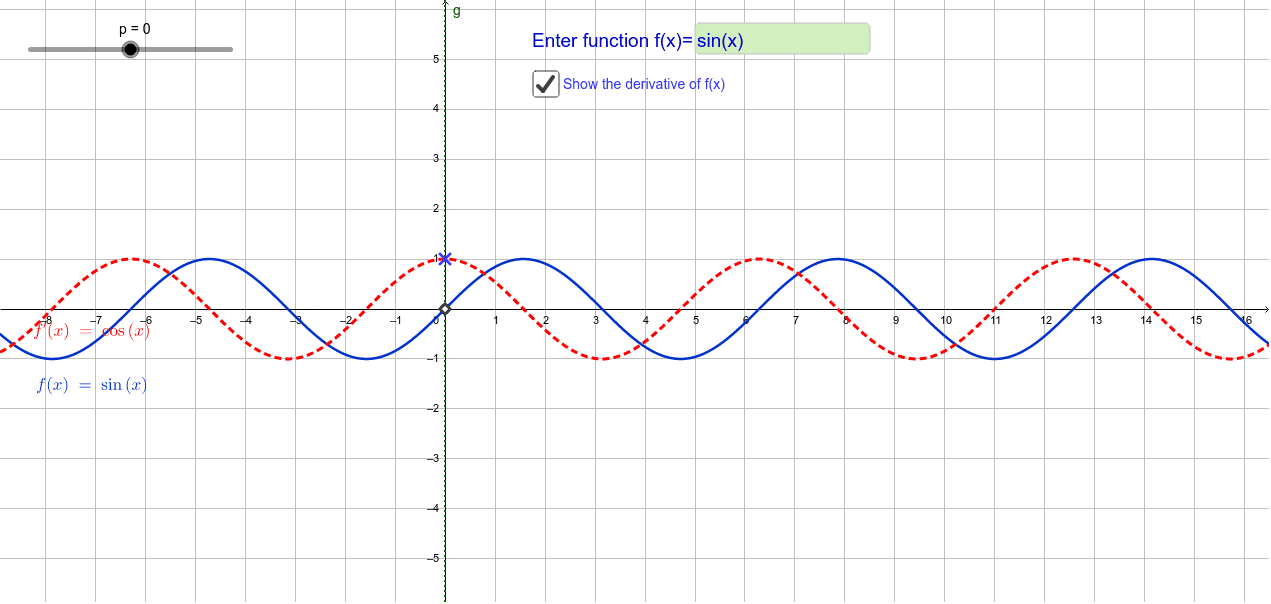
This example demonstrates how to sketch the graph of a function and its derivative, illustrating the relationship between them. Key math concepts include derivatives, linear functions, quadratic functions, matrix operations, and optimization problems. It uses GeoGebra commands like Textfield for annotations, Derivative for computing the derivative, and Intersect for finding intersections. Objects involved are function f, InputBox1, derivative f', parameter a, point p, function g, matrix A, points B and P. Suitable for high school and above students learning calculus and coordinate geometry to understand the correspondence between function and derivative graphs, and to analyze optimization problems.
GeoGebra Commands & Parameters
Textfield(f) → InputBox1Derivative(f) → f'Intersect(f', g, (0, 1)) → AIntersect(f, g, (0, 0)) → B
AI Drawing Prompt Reference
Draw the graph of a function and its derivative on the same coordinate plane, showing how they relate. Start with a curve for the original function, then add a second curve for its derivative. Include an input box where the function expression can be edited. Mark a point where the derivative curve intersects a given reference line, and another point where the original function intersects the same reference line. Add a slider to adjust a parameter that affects the function or reference line, and include a small matrix display for auxiliary calculations. Arrange everything clearly to highlight the correspondence between the function and its derivative at key points, useful for studying optimization.
The prompt above was compiled from the original drawing commands and is for reference only.