
265BFE Summer Jobs Example
Loading the math board and drawing, please wait…
In collections
Rate & Accumulation Yr 4 Much&Fast
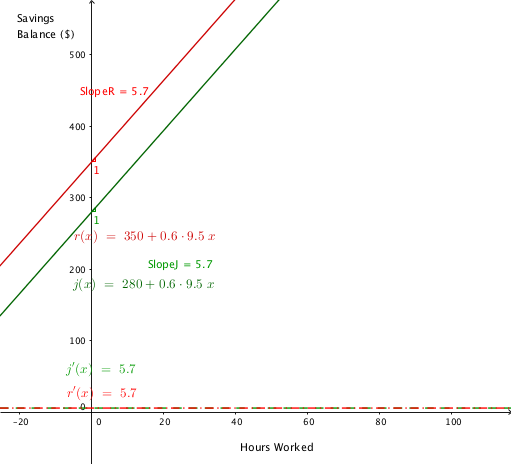
This example demonstrates how to use GeoGebra to construct and visualize mathematical concepts related to derivatives, linear programming or linear optimization, ratios, power functions, arithmetic, and cosine functions. Using commands and objects like Slope, j, r, SlopeJ, SlopeR, j', r', text1, and text2, it clearly illustrates the change in function slopes and the optimization process. Suitable for high school and early university students learning calculus and optimization methods.
GeoGebra Commands & Parameters
Slope(j) → SlopeJSlope(r) → SlopeR
AI Drawing Prompt Reference
Draw a coordinate plane with two function curves, each representing a different function. On each curve, mark a point and draw the tangent line at that point, using distinct colors or line styles for the two tangents. Label each tangent with its slope value to clearly show the rate of change at those points. The overall graph should clearly display the curves, tangent points, tangent lines, and slope labels, making it easy to observe the trends and optimization process.
The prompt above was compiled from the original drawing commands and is for reference only.