
Line Example with Vectors in Cartesian Coordinates
Loading the math board and drawing, please wait…
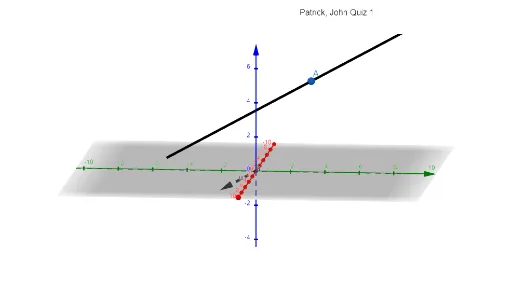
This GeoGebra example demonstrates how to use vectors to visualize direction and how to link that vector construction with a Cartesian curve (e.g., a line/curve described in Cartesian form). The main mathematical ideas are vectors (magnitude and direction) and coordinate geometry, using vector-direction information alongside a Cartesian-defined curve to build an interpretable geometric diagram. Construction highlights: it uses the GeoGebra commands “Vector” and “CurveCartesian” to create key objects (such as points/anchors like A, direction vectors like u and a), and it employs a text label object (text1) to annotate the relationship in the figure. Suitable for upper secondary and early university learners, this is ideal for quizzes, instruction on vector geometry, and practicing GeoGebra graphing of vector-based constructions.
GeoGebra Commands & Parameters
Vector((1, -2, -1)) → uCurveCartesian(-2 + t, 3 - (2 * t), 5 - t, t, -4, 4) → a
AI Drawing Prompt Reference
Draw a Cartesian curve specified by a parameter and visualize its relationship with a direction vector. First create a vector u with components (1, -2, -1) to represent magnitude and direction. Then plot curve a defined by the parametric rules x = -2 + t, y = 3 - (2t), z = 5 - t, with the parameter t restricted to the interval [-4, 4]. Finally, add a text annotation in the figure to explain how the vector’s direction information is linked to the parameter-defined curve (a line/curve in Cartesian form), so the diagram remains interpretable.
The prompt above was compiled from the original drawing commands and is for reference only.