
Limits: Introductory Questions
Loading the math board and drawing, please wait…
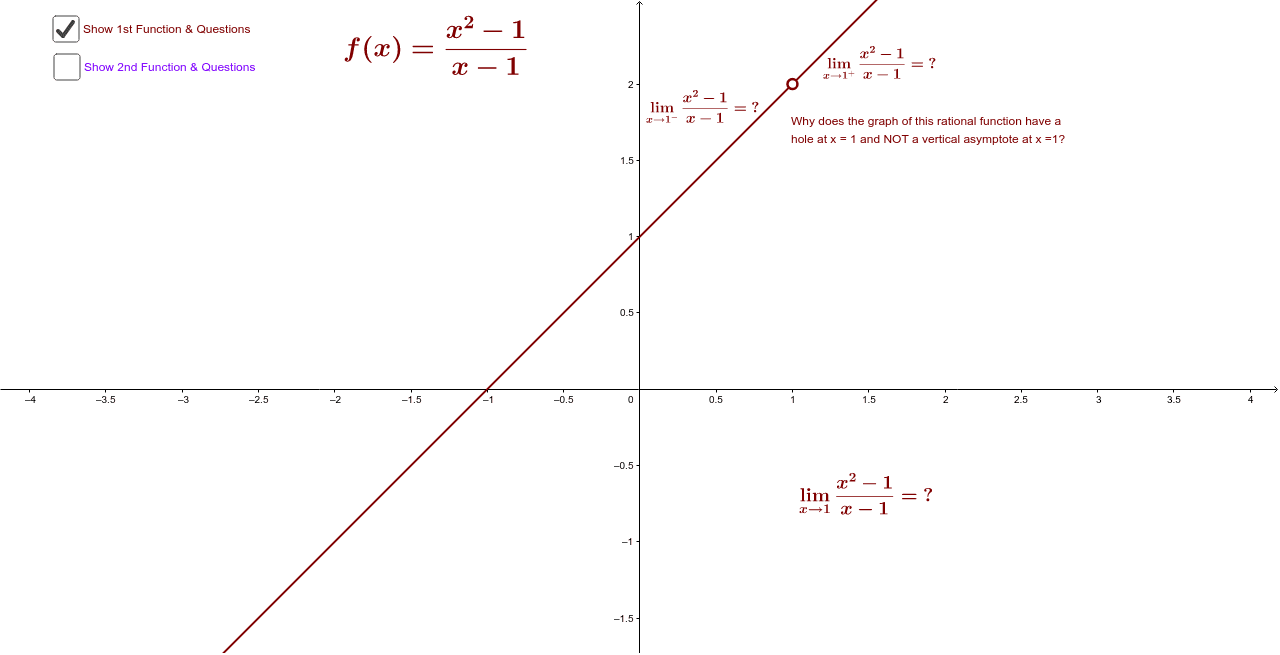
This example demonstrates the concept of limits through functions and ellipses using GeoGebra. Key mathematical concepts include limits, function graphs, ellipse geometry, and linear regression. Construction involves objects B, g, h, text1, a, q, f, A, and others, utilizing commands for ellipse creation, function plotting, and data point addition. Suitable for high school students or early university students to understand the relationship between limits and geometry.
GeoGebra Commands & Parameters
Point B(1.0, 0.5)g(x) = If[(-Infinity) ≤ x ≤ 0.95, (x - 1) / (x^(2) - 1)]h(x) = If[1.05 ≤ x ≤ Infinity, (x - 1) / (x^(2) - 1)]Line a(1.0, 0.0)q(x) = If[(-Infinity) ≤ x ≤ 0.97, (x^(2) - 1) / (x - 1)]f(x) = If[1.03 ≤ x ≤ Infinity, (x^(2) - 1) / (x - 1)]Point A(1.0, 2.0)Boolean c(true)Boolean b(false)
AI Drawing Prompt Reference
Draw a graph that includes an ellipse and function plots. The ellipse has its center at (1,0) with a major axis length of 2 and a minor axis length of 1. The function g(x) is defined for x from negative infinity to 0.95 as (x-1)/(x^2-1), and h(x) for x from 1.05 to positive infinity as (x-1)/(x^2-1). Additionally, q(x) is defined for x from negative infinity to 0.97 as (x^2-1)/(x-1), and f(x) for x from 1.03 to positive infinity as (x^2-1)/(x-1). The graph should also include point A at (1,2) and point B at (1,0.5). Ensure these elements are correctly placed and maintain proportional relationships.
The prompt above was compiled from the original drawing commands and is for reference only.