
Limits and Continuity Example 1
Loading the math board and drawing, please wait…
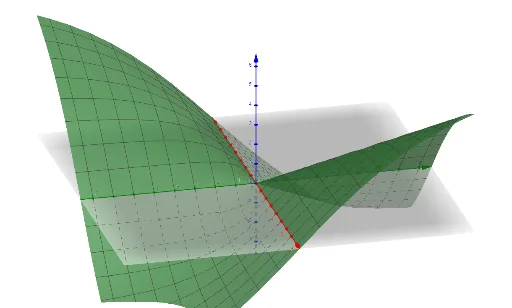
This example demonstrates the graphical interpretation of function limits and continuity. Core math concepts involved include limits, continuity, arithmetic operations, distributions, differential calculus, conditional probability, and quadratic functions. The construction uses the GeoGebra object 'f' to plot function graphs, aiding in understanding the definitions and properties of limits and continuity. Suitable for high school and above mathematics learners to visually grasp fundamental calculus concepts.
GeoGebra Commands & Parameters
f(x, y) = ((x * y)) / sqrt(x^(2) + y^(2))
AI Drawing Prompt Reference
Draw the graph of a function defined as the product of two variables divided by the square root of the sum of their squares, to illustrate its graphical representation and aid in understanding the concepts of limits and continuity.
The prompt above was compiled from the original drawing commands and is for reference only.