
Limit of sin(x)/x
Loading the math board and drawing, please wait…
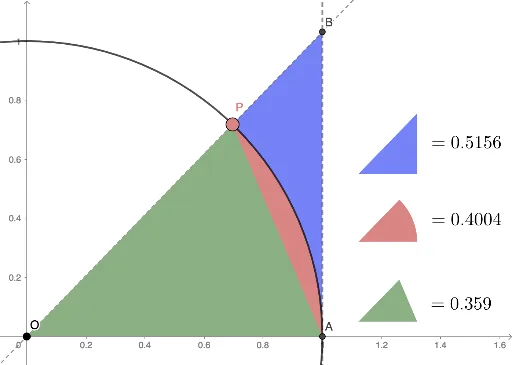
This example demonstrates the limit of sin(x)/x. Key mathematical concepts include trigonometric functions and limits. Using commands such as Circle, Intersect, CircleArc, Point, Line, Polygon, CircleSector, OrthogonalLine, and Dilate, the graph of sin(x)/x can be constructed. Suitable for high school mathematics education and learning.
GeoGebra Commands & Parameters
Circle(O, 1) → cIntersect(c, f, 1) → AIntersect(c, yAxis, 2) → B_1CircleArc(O, A, B_1) → dPoint(d) → PLine(O, P) → gIntersect(f, g) → BPolygon(O, A, B) → t1, b, o, a_2CircleSector(O, A, P) → ePolygon(O, A, P) → t2, p, o_1, a_1Point(xAxis) → COrthogonalLine(C, xAxis) → hPoint(h) → DPoint(h) → EDilate(O, a, D) → O'Dilate(A, a, D) → A'Dilate(B, a, D) → B'Polygon(O', A', B') → t1', b', o', a'Dilate(e, a, E) → e'Point(h) → FDilate(O, a, F) → O'_1Dilate(A, a, F) → A'_1Dilate(P, a, F) → P'Polygon(O'_1, A'_1, P') → t2', p', o'_1, a'_1
AI Drawing Prompt Reference
Draw the graph of sin(x)/x and demonstrate its limit as x approaches 0. Start by drawing a unit circle, then find the intersection point A between the circle and the function. Draw an arc and point P, then draw a line g through P that intersects the function at point B. Use points O, A, and B to construct polygons t1 and b, then draw a sector e with a central angle of π/2. Construct polygons t2 and p, then take point C on the x-axis and draw a perpendicular line h through C, taking points D and E on h, and use D and E to scale the original figure, resulting in new polygons t1', b', o', and a', as well as t2', p', o'_1, and a'_1.
The prompt above was compiled from the original drawing commands and is for reference only.