
Limit Analyzer
Loading the math board and drawing, please wait…
In collections
BC Calculus
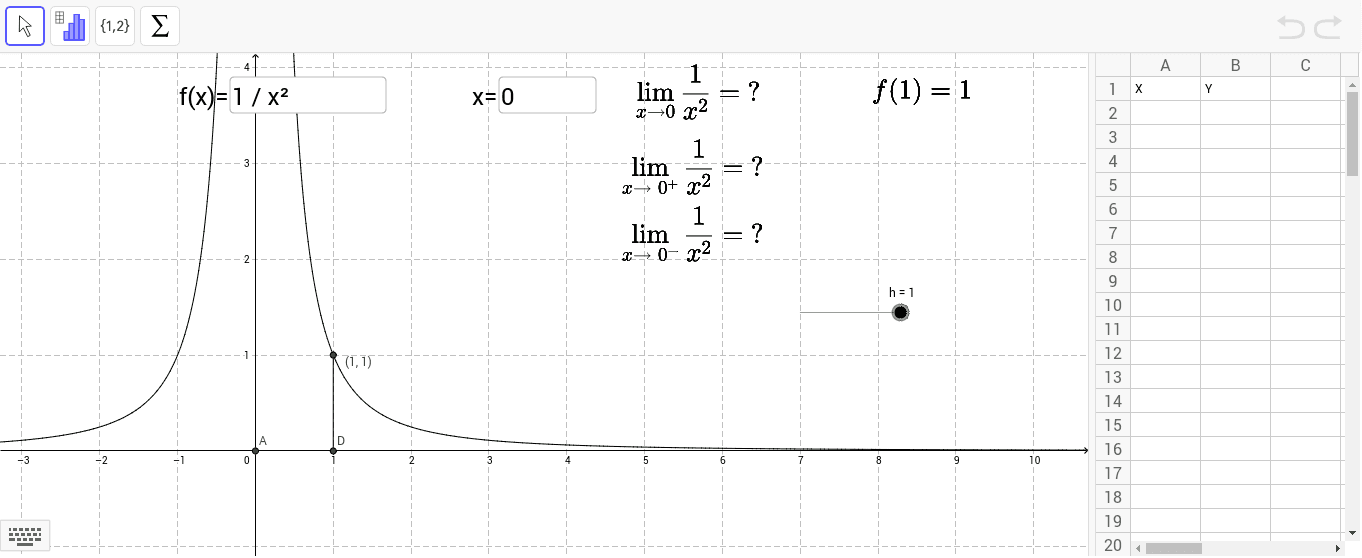
This example demonstrates a dynamic limit analyzer on function graphs, dynamically showing limit values. Core math concepts include limits, distributions, polygons, expected value, logarithmic functions, and derivatives. Constructed using GeoGebra commands/objects like Limit, Textfield, LimitAbove, LimitBelow, Segment, Name. Suitable for high school and above mathematics learners to understand limit concepts and function properties.
GeoGebra Commands & Parameters
Limit(f, limitx) → aTextfield(f) → inputBox1Textfield(limitx) → inputBox2LimitAbove(f, limitx) → bLimitBelow(f, limitx) → cSegment(D, C) → dName(X) → A1Name(Y) → B1
AI Drawing Prompt Reference
Draw a dynamic limit analyzer showing function graphs and limit values. Include input boxes for the function and limit point, plot the function, and display the limit values above and below the function. Connect the upper and lower limit values with a line segment, labeling the function and limit point. Start with the function graph, then add input boxes and limit values, finally connect the limits.
The prompt above was compiled from the original drawing commands and is for reference only.