
Lesson 8b Construction of Polygons: From Segments to Parametric Curves
Loading the math board and drawing, please wait…
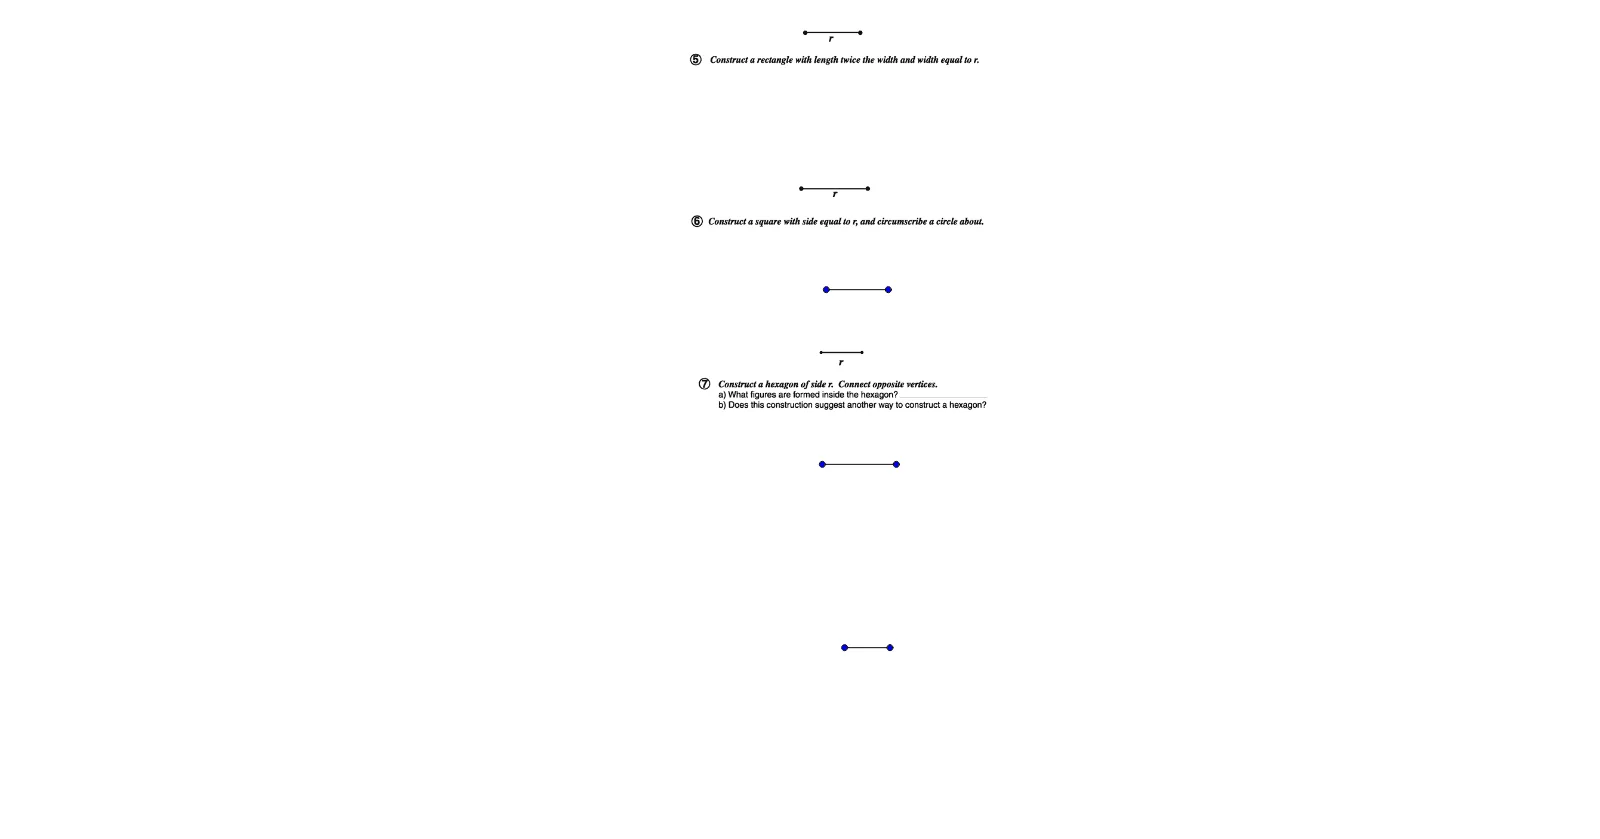
This GeoGebra example demonstrates the step-by-step construction of various polygons, including triangles, equilateral triangles, and more complex shapes that integrate parametric curves and exponential functions, with a pie chart visualizing angle or side distributions. The core mathematical concepts cover polygon properties, equilateral triangle characteristics, parametric curve representation, and exponential function graphs. The construction uses the Segment command to connect points A, B, C, D, E, F, G, and incorporates an image object (pic1) as a background reference, creating segments a, b, c to form polygon edges, while sliders or parameters enable dynamic adjustments. This resource is ideal for middle school geometry lessons on polygon construction, as well as for undergraduate mathematics labs focusing on the interplay between geometric construction and function graphing, enhancing students' spatial reasoning and logical deduction skills.
GeoGebra Commands & Parameters
Segment(A, C) → aSegment(D, E) → bSegment(F, G) → c
AI Drawing Prompt Reference
Draw a polygon with triangles and complex shapes, connecting points A and C to form segment a, points D and E to form segment b, and points F and G to form segment c. Use parameters and sliders to dynamically adjust the shape, incorporating parametric curves and exponential functions, and finally displaying the distribution of angles or side lengths with a pie chart.
The prompt above was compiled from the original drawing commands and is for reference only.