
Learning Parametric Curves
Loading the math board and drawing, please wait…
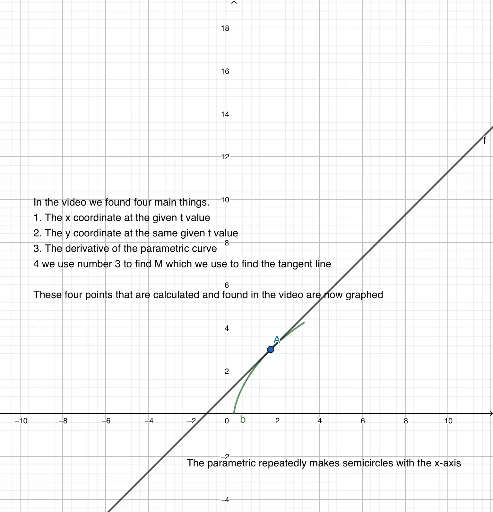
This example demonstrates how to plot parametric curves using GeoGebra, showcasing their graphical transformations. Core math concepts include parametric equations, coordinate geometry, derivatives, and locus. It utilizes GeoGebra commands like CurveCartesian for plotting curves and Tangent for calculating tangents, along with objects such as a, b, text1, A, f, text2, text3 for parameter control and annotations. Suitable for high school and above students to understand the application and geometric meaning of parametric equations.
GeoGebra Commands & Parameters
CurveCartesian((3 * (t - sin(t))), (3 * (1 - cos(t))), t, 0, a) → bTangent(A, b) → f
AI Drawing Prompt Reference
Draw a parametric curve showing its graphical transformations as the parameter changes, where the curve is formed by the product and difference of two functions over a range from 0 to a, with key points marked on the curve. Also, plot the tangent line to the curve at a specific point, ensuring it touches the curve at that point, visually demonstrating the concepts of parametric equations, coordinate geometry, derivatives, and loci.
The prompt above was compiled from the original drawing commands and is for reference only.