
Learn Characteristics of the Normal Distribution and Z-Scores
Loading the math board and drawing, please wait…
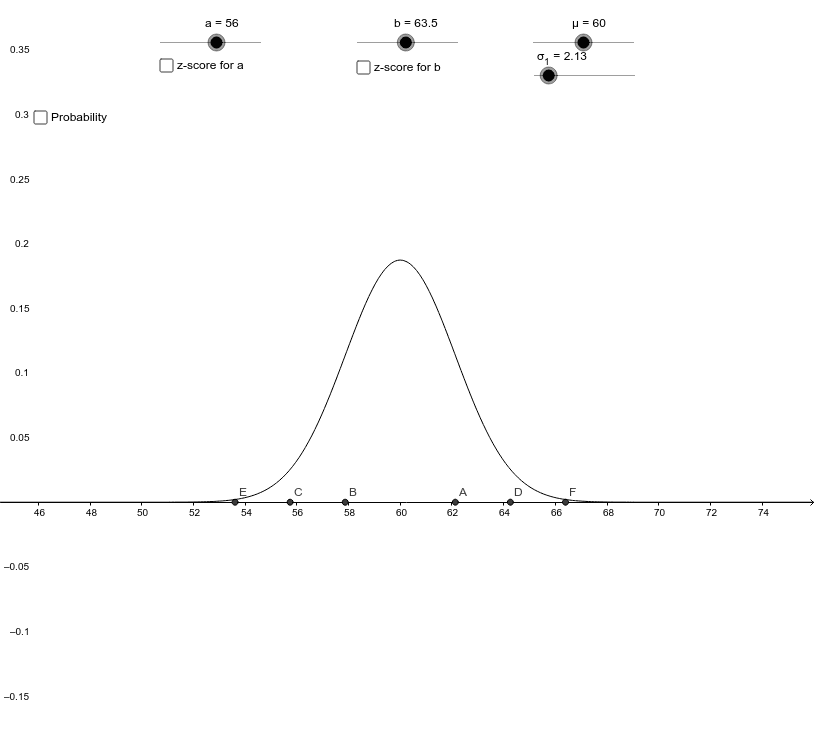
This example demonstrates the characteristics of the normal distribution curve and the meaning of z-scores. It uses GeoGebra commands such as Segment, Normal, Point, Integral, etc. Suitable for high school and above students to learn probability and statistics.
GeoGebra Commands & Parameters
Segment(G, A) → a_1Normal(μ, σ_1, -0.5) → P1Point(xAxis) → HIntegral(f, a, b) → Prob
AI Drawing Prompt Reference
Draw a normal distribution curve with mean 0 and standard deviation 1 from -0.5 to positive infinity. Mark a point H on the x-axis. Calculate and show the area under the curve from -0.5 to a point specified by the user.
The prompt above was compiled from the original drawing commands and is for reference only.