
Mean and Standard Deviation of a Discrete Random Variable
Loading the math board and drawing, please wait…
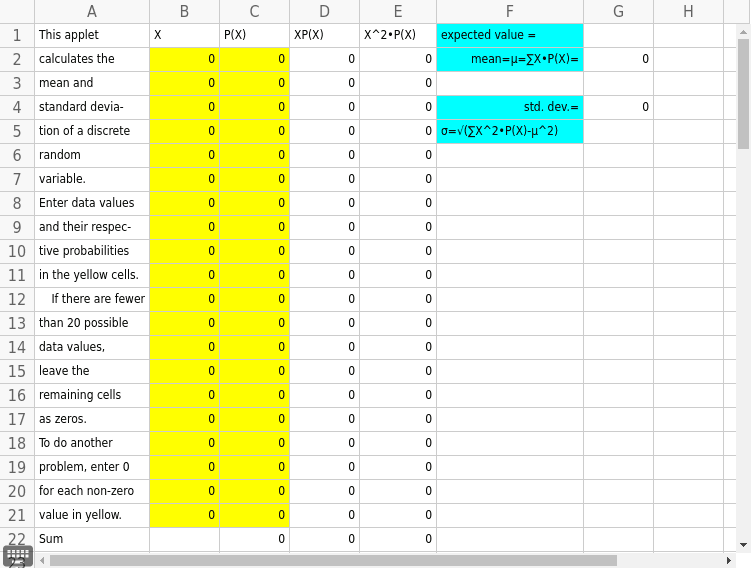
This example demonstrates how to calculate the mean and standard deviation of a discrete random variable. By adjusting the distribution of the variable, one can intuitively understand the meaning of these statistical measures. Key mathematical concepts include expected value and variance. GeoGebra commands such as Sum are used for calculations. Suitable for high school mathematics education and learning.
GeoGebra Commands & Parameters
Sum(C2:C21) → C22Sum(E2:E21) → E22Sum(D2:D21) → D22
AI Drawing Prompt Reference
Create a visualization for a discrete random variable, showing its probability distribution, mean, and standard deviation. Start by plotting a bar chart to represent the probability distribution based on variable values and their corresponding probabilities. Then, mark the mean and standard deviation on the graph with distinct colors or symbols and include text labels. Finally, verify the calculated mean and standard deviation using sum values, making the statistical concepts visually clear in the illustration.
The prompt above was compiled from the original drawing commands and is for reference only.