
Leading Coefficient and Graph of a Quadratic Function
Loading the math board and drawing, please wait…
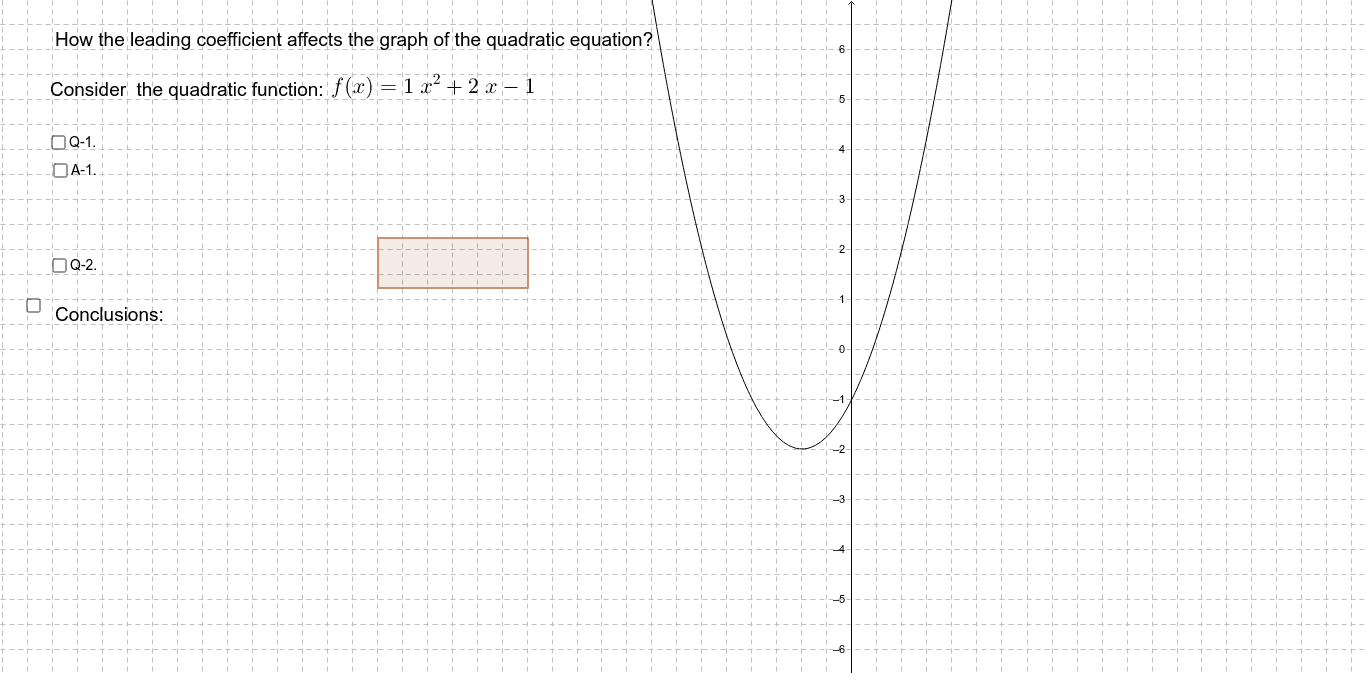
This example demonstrates how the leading coefficient affects the shape and direction of the quadratic function's graph. Key math concepts include quadratic functions, coefficients, graph transformations, and symmetry axes. Construction highlights involve GeoGebra commands like Polygon, Midpoint, Point, and Segment. Suitable for high school mathematics education to understand the geometric significance of quadratic function coefficients.
GeoGebra Commands & Parameters
Polygon(A, B, C, D) → poly1, a_1, b_1, c_1, d_1Midpoint(d_1) → EMidpoint(b_1) → FMidpoint(A, E) → GMidpoint(B, F) → HMidpoint(E, D) → IMidpoint(F, C) → JPoint(a_1) → KPoint(c_1) → LPoint(a_1) → MPoint(c_1) → NMidpoint(M, N) → RMidpoint(M, R) → SMidpoint(R, N) → TPolygon(M, B, H, S) → poly2, m, b_2, h_1, sMidpoint(K, L) → OMidpoint(K, O) → PMidpoint(O, L) → QPolygon(A, K, P, G) → poly3, a_2, k_1, p, g_1Polygon(E, O, Q, I) → poly4, e_1, o, q, iPolygon(R, F, J, T) → poly5, r, f_1, j, tSegment(K, L) → nSegment(M, N) → i_1Segment(O, R) → j_1Polygon(U, V, W, Z) → poly6, u_1, v_1, w_1, z_1
AI Drawing Prompt Reference
Draw a graph of a quadratic function, showing its vertex, axis of symmetry, and direction of opening. Start by creating a quadrilateral, then find midpoints of each side and connect them to form an inner quadrilateral. Next, draw line segments from the vertices and locate their midpoints for further construction. Finally, combine all parts into multiple quadrilaterals and segments to form a complete graph, illustrating how the leading coefficient affects the shape.
The prompt above was compiled from the original drawing commands and is for reference only.