
Sign Analysis of Quadratic Functions
Loading the math board and drawing, please wait…
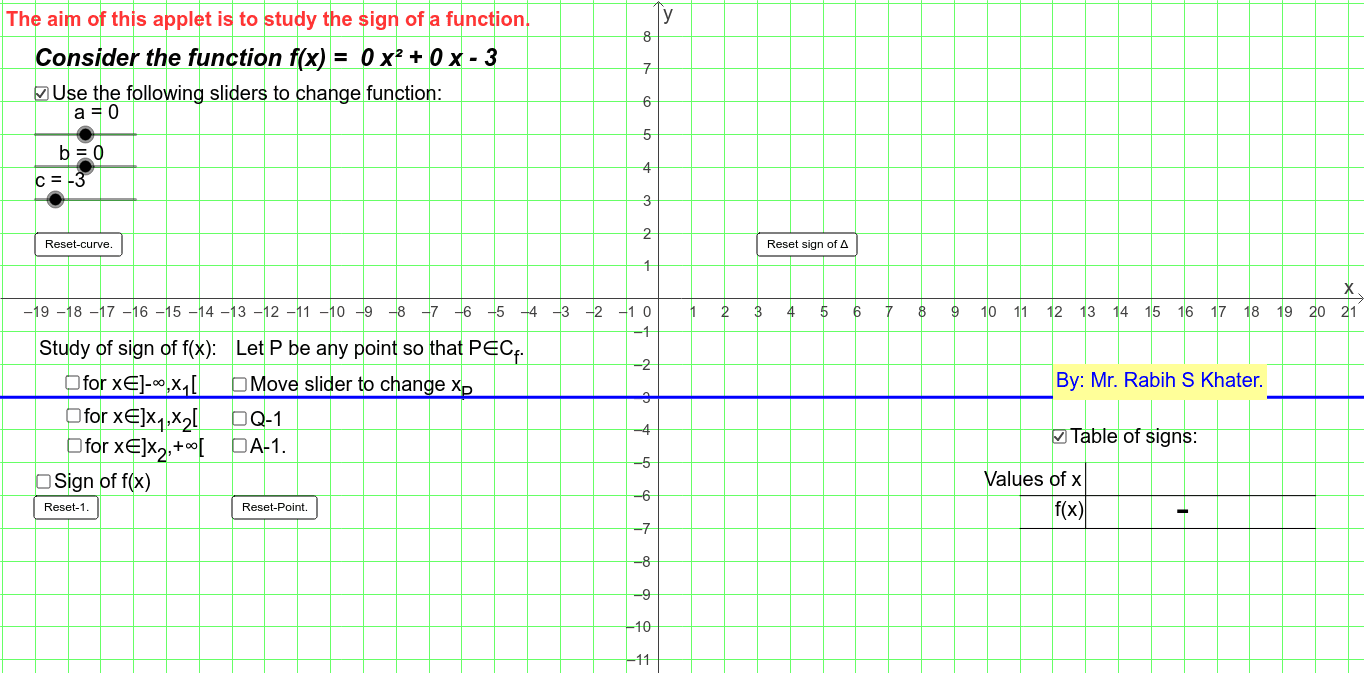
This example demonstrates the sign behavior of quadratic functions using both graphical analysis and the discriminant. Key math concepts include quadratic functions, discriminants, function graphs, roots, and coefficient relationships. GeoGebra commands and objects used in construction are Root (for finding roots), Function (for plotting), Extremum (for vertex), If (for conditional logic), Segment (for line segments), Vector (for vectors), Midpoint (for midpoints), and Factor (for factoring). Suitable for high school students learning about function properties, relationships between roots and graphs, and discriminant applications.
GeoGebra Commands & Parameters
Root((a * x^(2)) + (b * x) + c) → R_1, R_2Function((a * x^(2)) + (b * x) + c, l_l, l_u) → f_mFunction((a * x^(2)) + (b * x) + c, -70, l_l) → f_lFunction((a * x^(2)) + (b * x) + c, l_u, 100) → fExtremum((a * x^(2)) + (b * x) + c) → TIf(s < 0, 0, If[s ≟ 0, 0, 1]) → colour1If(s < 0, 1, 0) → colour2If(a > 0, 1, If[a ≟ 0, 0, -1]) → sign1Segment(R_2, M_R) → dotted1Vector(M_R, M_RR) → v_1Segment(R_1, M_L) → dotted2Segment(M_IL, M_IR) → jMidpoint(j) → M_imSegment(R_1, M_IL) → dotted3Segment(R_2, M_IR) → dotted4If(a < 0, Simplify[(-x) + factored2], Simplify[x - factored2]) → factoredexp2If(a^(2) ≟ 0, sgn(b), 1) → v_2signVector(M_L, M_LL) → v_2Factor(f_n) → qIf(sqrt(b^(2) - ((4 * a) * c)) - floor(sqrt(b^(2) - ((4 * a) * c))) > 0, "Not Factorizable", "Can") → text2ndIf(b^(2) - ((4 * a) * c) < 0, "No Real Roots!", text2nd) → textDetFactorSegment(A, B) → dSegment(C, D) → eSegment(E, F) → g
AI Drawing Prompt Reference
Draw the graph of a quadratic function, showing its direction, vertex, roots, and sign analysis using the discriminant. Plot the function first, then mark the vertex and roots, using different colors to indicate the sign of the function in different intervals. Based on the discriminant value, label whether the function has real roots and connect the roots to the corresponding midpoints with dashed lines. Finally, display the factored form of the function and its opening direction based on the coefficient relationships.
The prompt above was compiled from the original drawing commands and is for reference only.